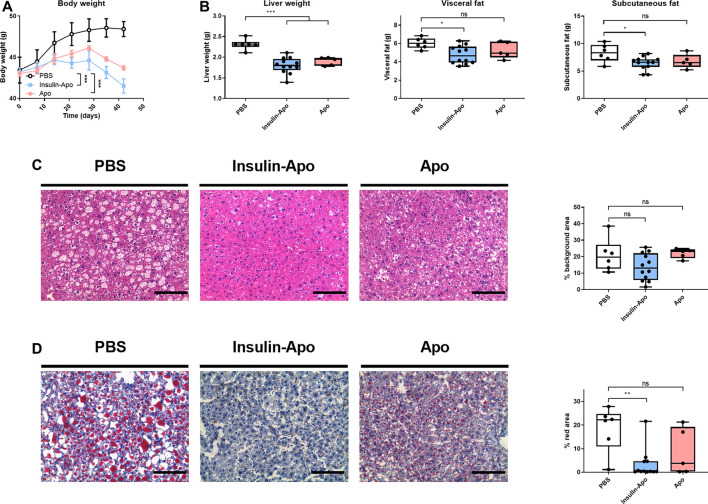
FIGURE 8.
Effect of long term treatment of apolipoprotein A-I alone or fused to insulin in db/db mice. Male 10 weeks-old db/db mice were treated daily for six weeks with PBS, 26 nmol/kg human apolipoprotein A-I s.c., or 26 nmol/kg Insulin-Apo s.c. Mice were sacrificed at the end of the study. (A) Evolution of body weight during the study period. (B) Liver weight, visceral fat weight, and subcutaneous fat weight after treatment for 6 weeks (C) Representative images of hematoxylin-eosin staining of livers after treatment for 6 weeks and quantification of the background area. Scale bars, 50 µm. (D) Representative images of Oil red O staining of livers after treatment for 6 weeks and quantification of the red area. Scale bars, 50 μm n = 6 for PBS group, n = 12 for Insulin-Apo-treated group and n = 5 for Apo-treated group *p < 0.05, **p < 0.01, ***p < 0.001.

