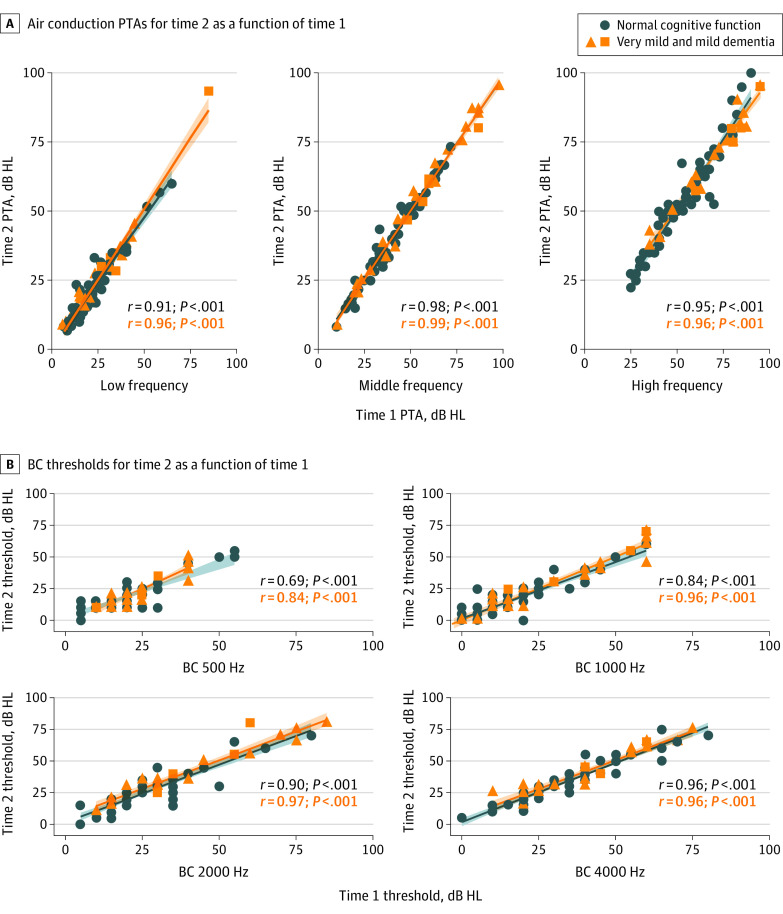
Figure 2. Hearing Sensitivity Scatterplots.
A, Low- (250, 500, and 1000 Hz), middle- (2000, 3000, and 4000 Hz), and high-frequency (6000 and 8000 Hz) pure-tone air conduction threshold averages for time 2 as a function of time 1. B, Bone conduction (BC) thresholds at 500, 1000, 2000, and 4000 Hz for time 2 as a function of time 1. HL indicates hearing level; PTA, pure-tone average. Shaded areas around lines indicate 95% CIs.

