Figure 5.

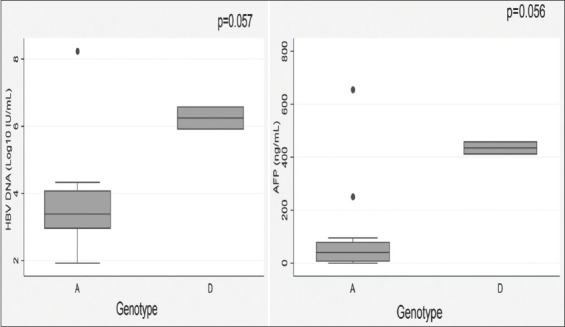
Graphical representation of the median and interquartile ranges of hepatitis B virus (HBV) DNA and serum AFP levels across HBV genotypes A and D

Graphical representation of the median and interquartile ranges of hepatitis B virus (HBV) DNA and serum AFP levels across HBV genotypes A and D