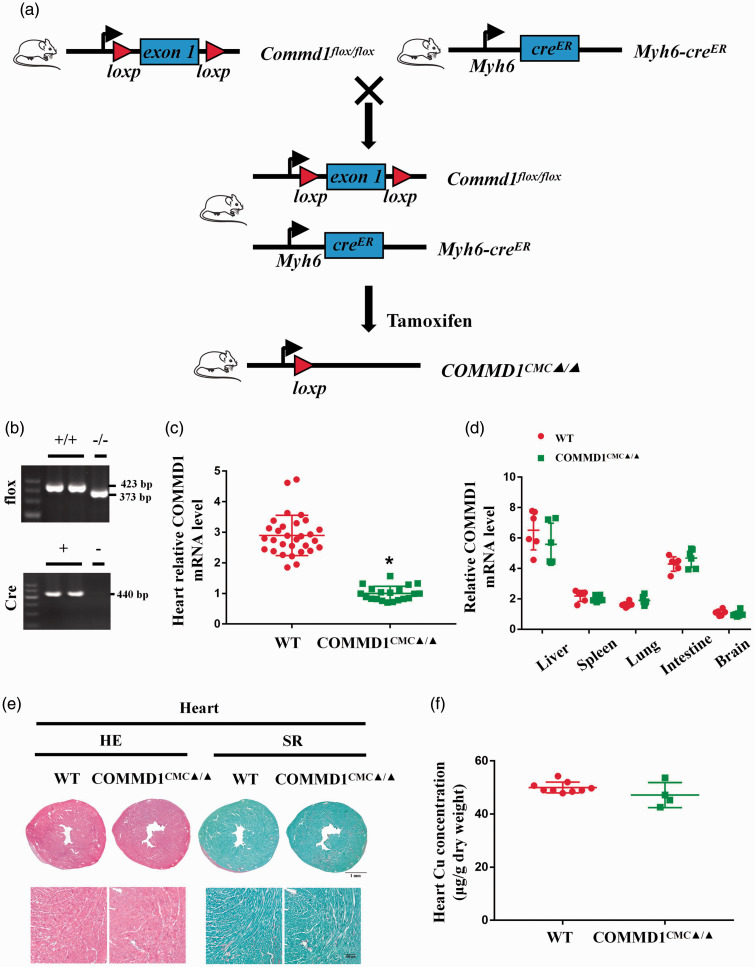
Figure 2.
Generation and characterization of cardiomyocyte-specific Commd1 knockout mice. (a) Generation of cardiomyocyte-specific Commd1 knockout mice. (b) PCR analysis of Commd1flox and Cre genes in tails. (c) RT-PCR analysis of Commd1 expression in cardiac tissues, WT: n = 30; COMMD1CMC▲/▲: n = 20. (d) RT-PCR analysis of Commd1 expression in liver, spleen, lung, intestine, and brain, n = 6 per group. (e) Images of HE and SR staining of heart sections after three weeks of tamoxifen induction, scale bar = 1 mm for the upper panel and 100 µm for the lower panel. (f) AAS analysis of copper concentrations in the cardiac tissues three weeks after tamoxifen induction, WT: n = 9; COMMD1CMC▲/▲: n = 4. Data were expressed as mean ± SD and analyzed using Student's t-test, *P < 0.05 versus WT control. (A color version of this figure is available in the online journal.)

