
Fig. 1.
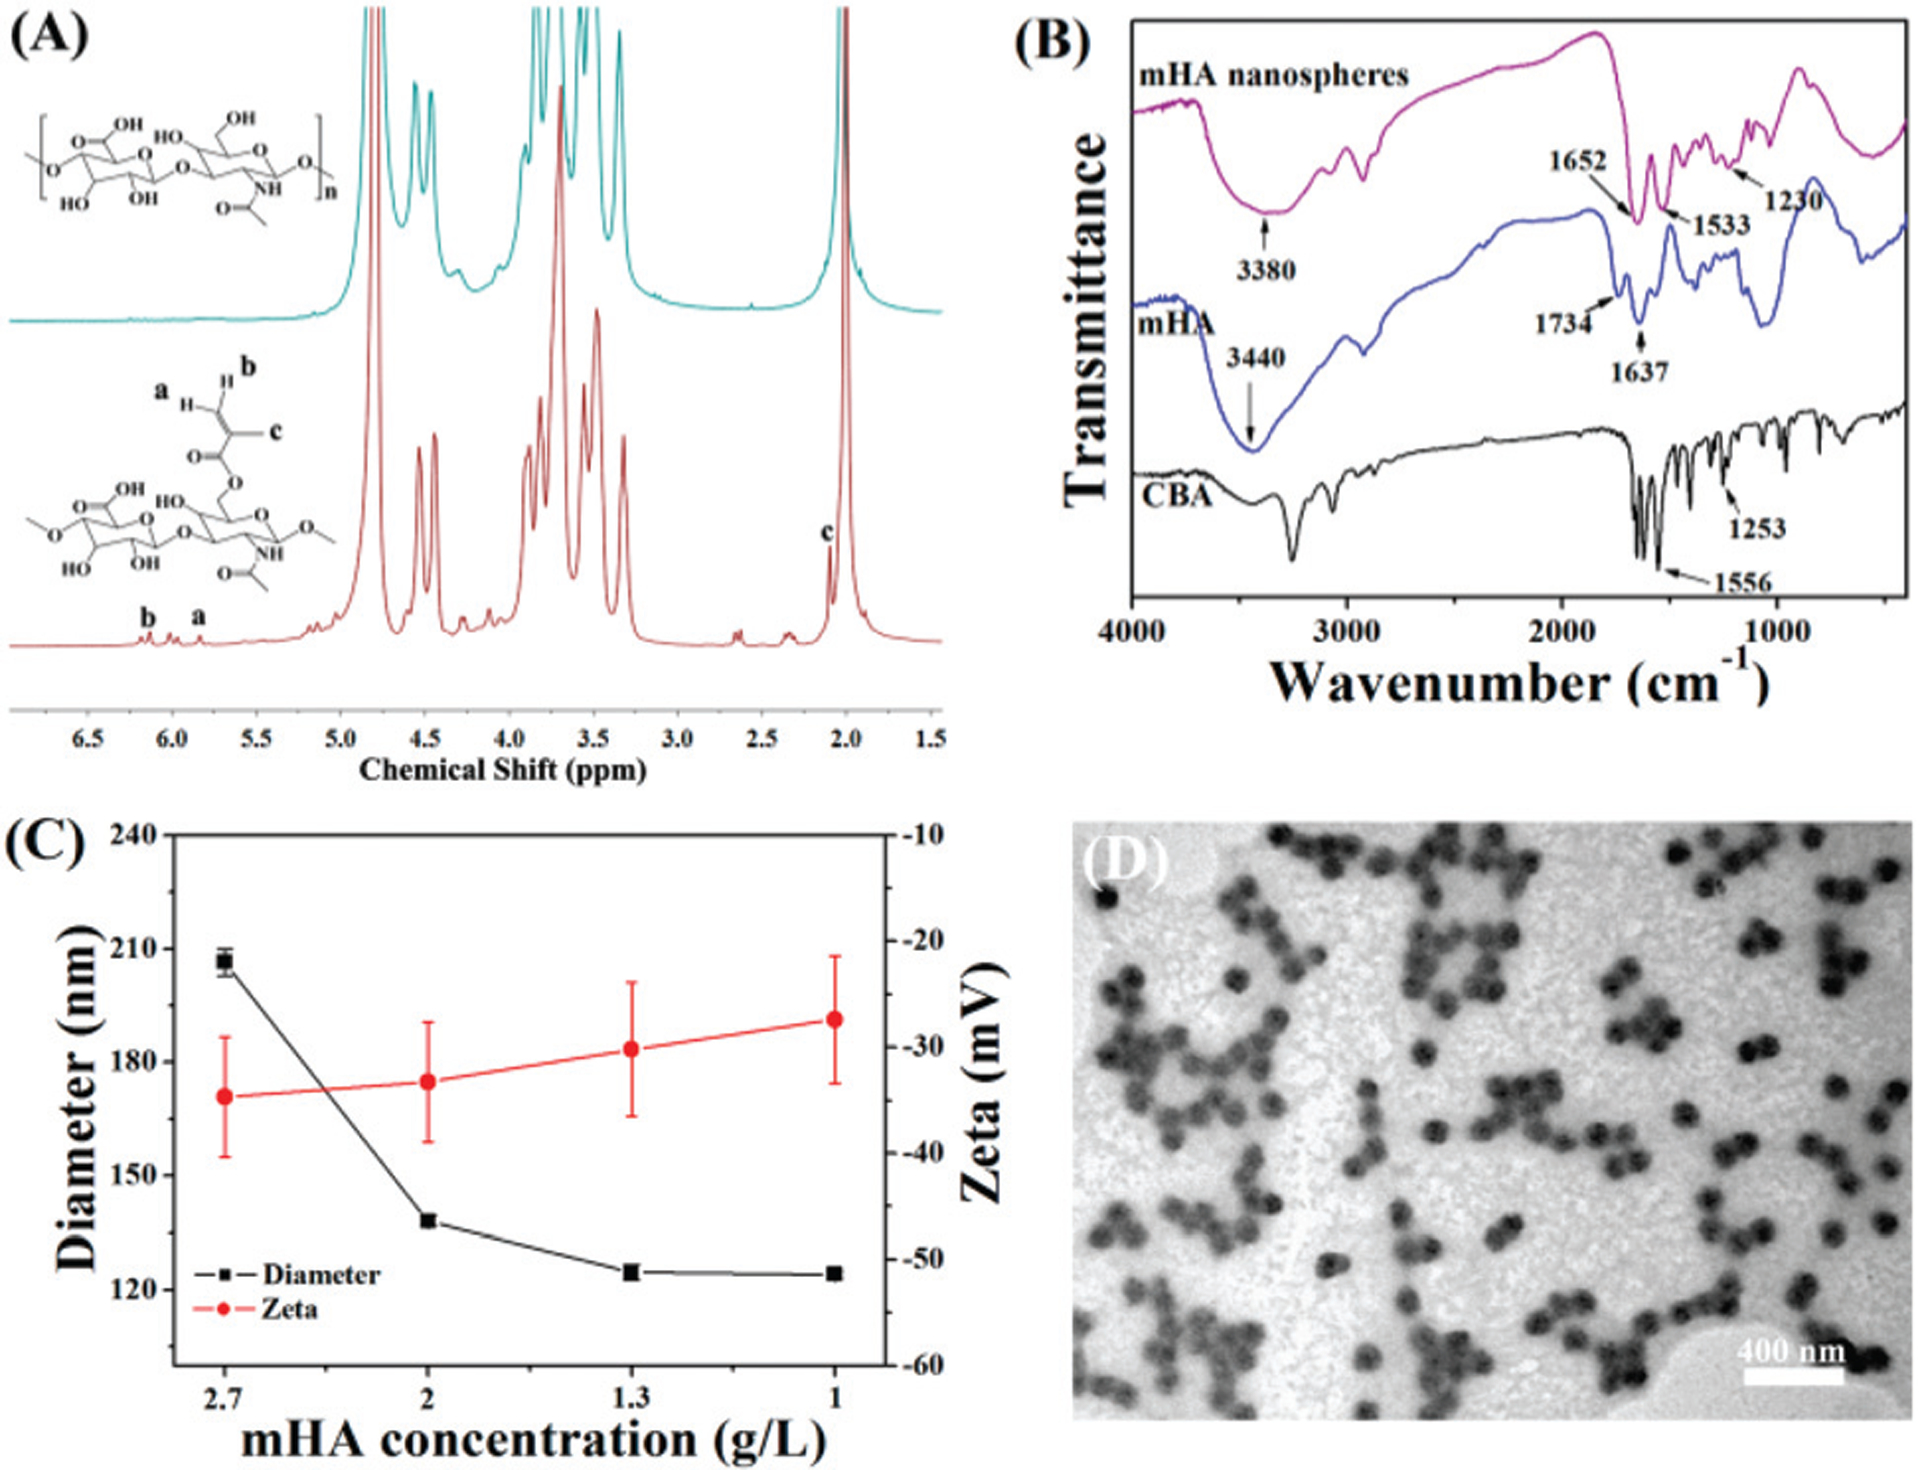
(A) 1H NMR spectra of HA (up) and mHA (bottom). (B) FT-IR spectra of mHA, CBA and mHA nanogels. (C) Diameter and zeta potential of mHA nanogels obtained with different concentrations of mHA (data are represented as means ± SD, n = 3); (D) TEM image of the mHA nanogels.