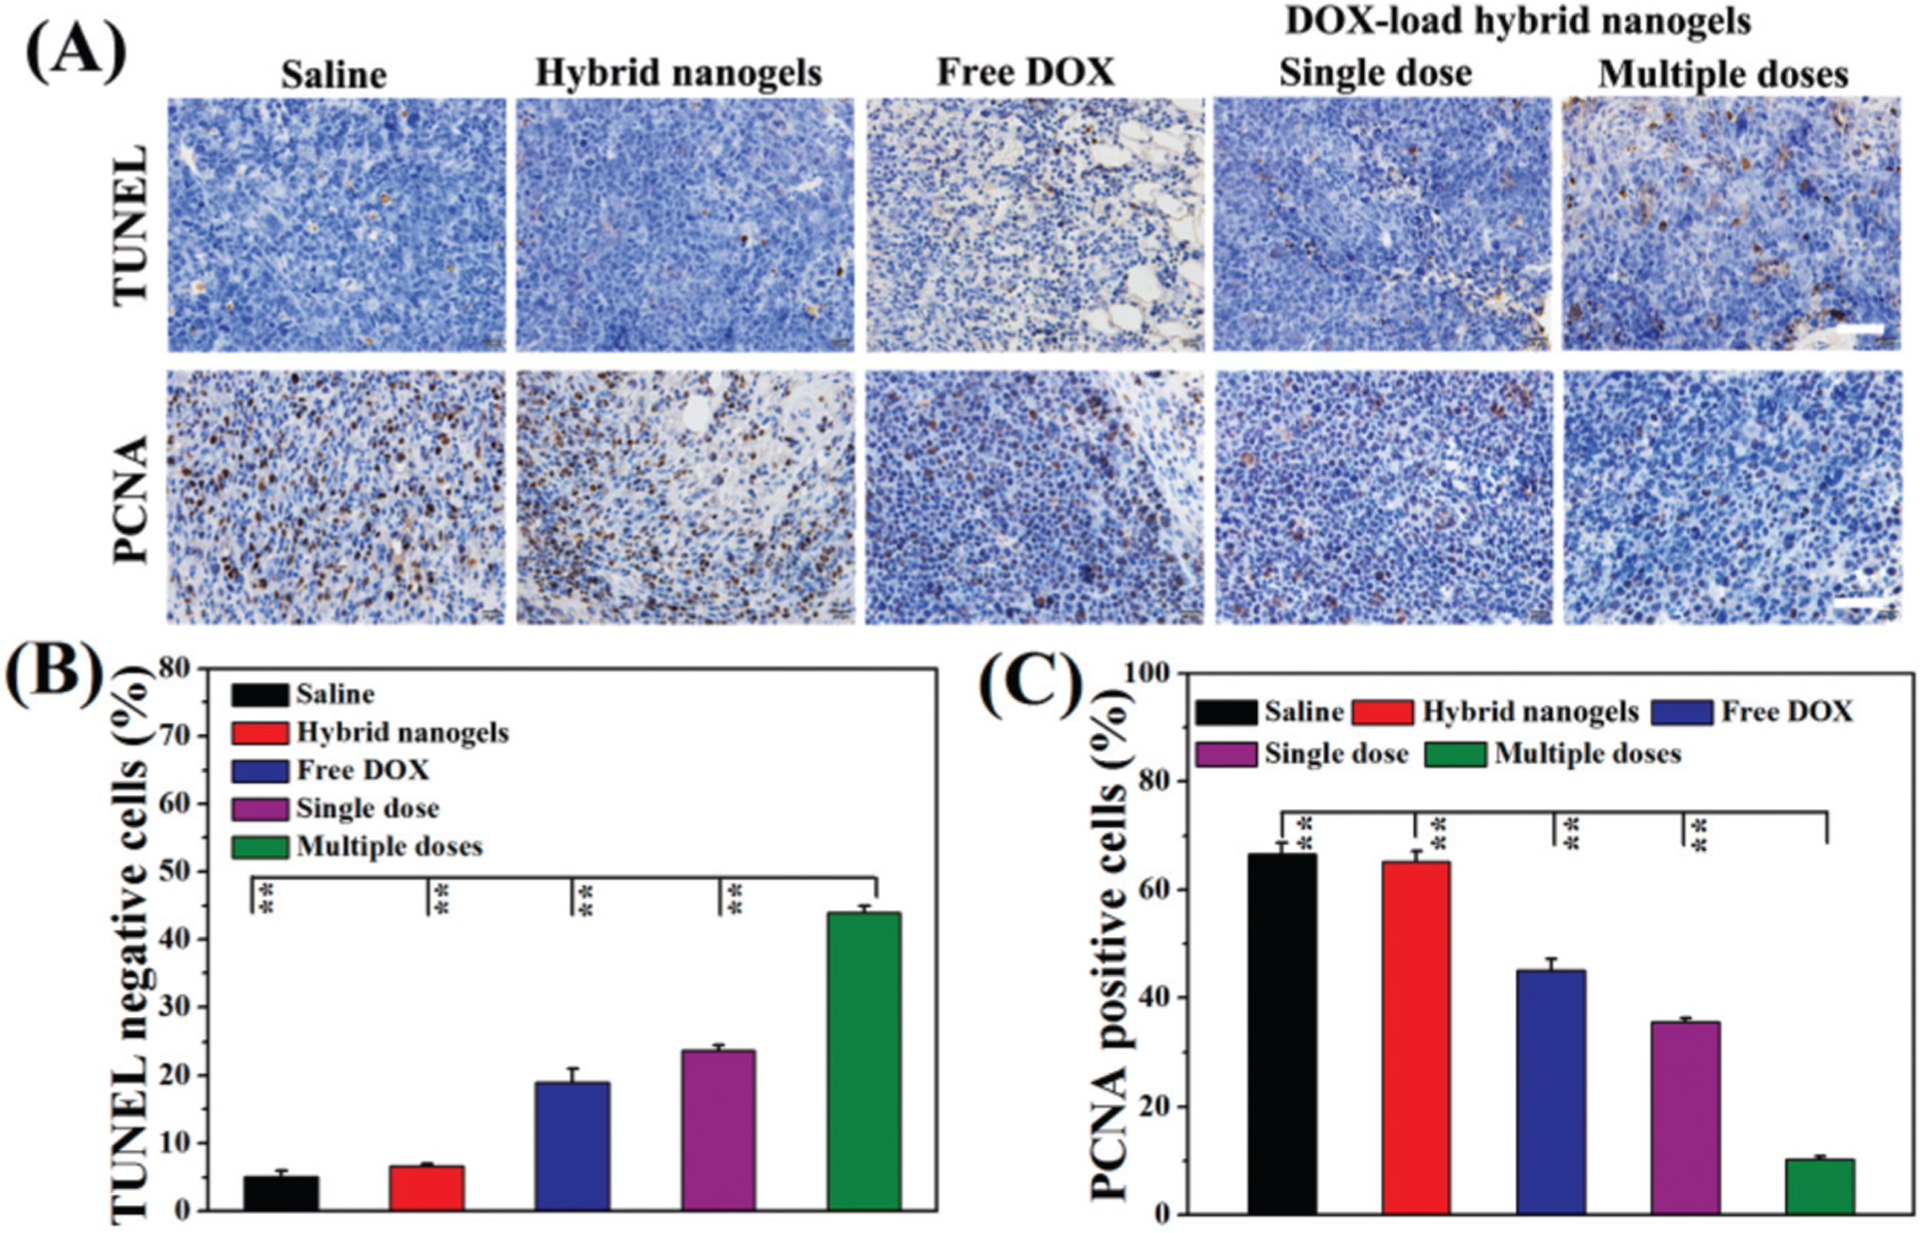
Fig. 8.

(A) The TUNEL and PCNA observations of H22 tumors obtained from the mice receiving various treatments. The scale bar in each figure is 50 μm. The comparison of apoptotic cells (B) and proliferating cells (C) in H22 tumors obtained from the mice (** represents P < 0.01).
