. 2021 Mar 4;11(3):e044753. doi: 10.1136/bmjopen-2020-044753
© Author(s) (or their employer(s)) 2021. Re-use permitted under CC BY. Published by BMJ.
This is an open access article distributed in accordance with the Creative Commons Attribution 4.0 Unported (CC BY 4.0) license, which permits others to copy, redistribute, remix, transform and build upon this work for any purpose, provided the original work is properly cited, a link to the licence is given, and indication of whether changes were made. See: https://creativecommons.org/licenses/by/4.0/.
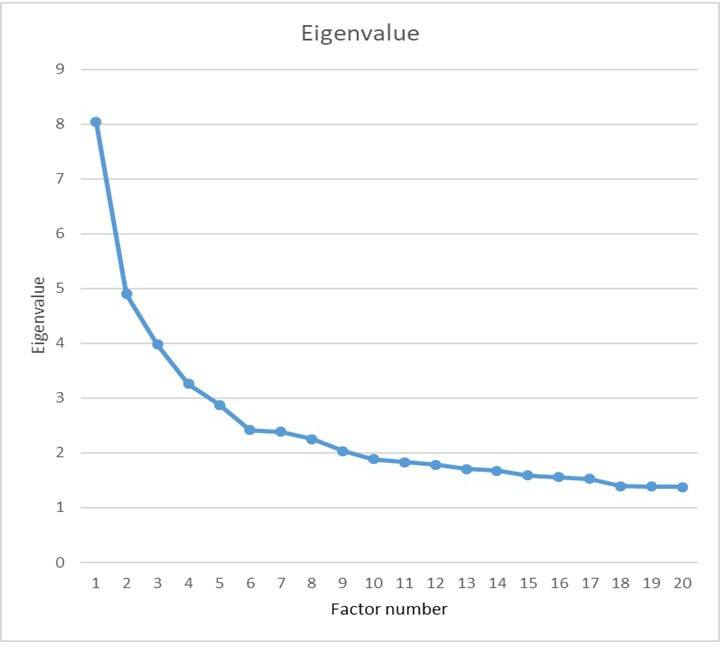
Figure 8.

Scree plot for the factor analysis of 87 attitudinal variables.
