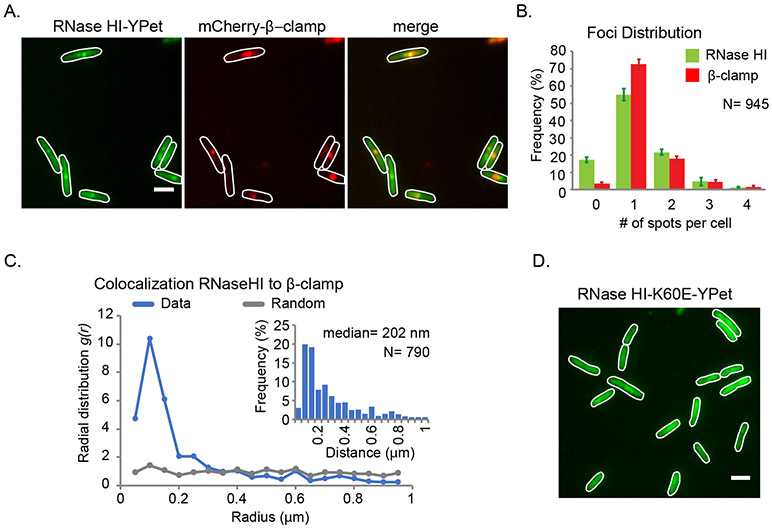
Figure 1. SSB-mediated localization of RNase HI to the replication fork.
Fluorescence microscopy studies of E. coli strains expressing the fluorescent fusion proteins RNase HI-YPet and β-clamp-mCherry. (A) Representative images showing RNase HI-YPet (left), β-clamp-mCherry (middle) and a merged image showing the overlap of RNase HI-YPet and β-clamp-mCherry (right) in strain VV11. Digital contrast enhancement was used for presentation purposes. Scale bar in the right image is 2 μm. (B) Detectable RNase HI-YPet and β-clamp-mCherry foci per cell are plotted as the frequency for the cell population. (C) Radial distribution function for RNase HI-YPet and β-clamp-mCherry representing colocalization (blue line). As comparison, g(r) is plotted for a set of randomly distributed spots in cells (grey line). Inset shows the distribution of nearest-neighbor distances between spots of RNase HI-YPet and β-clamp-mCherry. (D) Representative fluorescent image of showing RNase HI K60E-YPet fusion protein distributed throughout strain VV08. Imaging conditions and digital contrast enhancement used were as in 1B. Scale bar is 2 μm.

