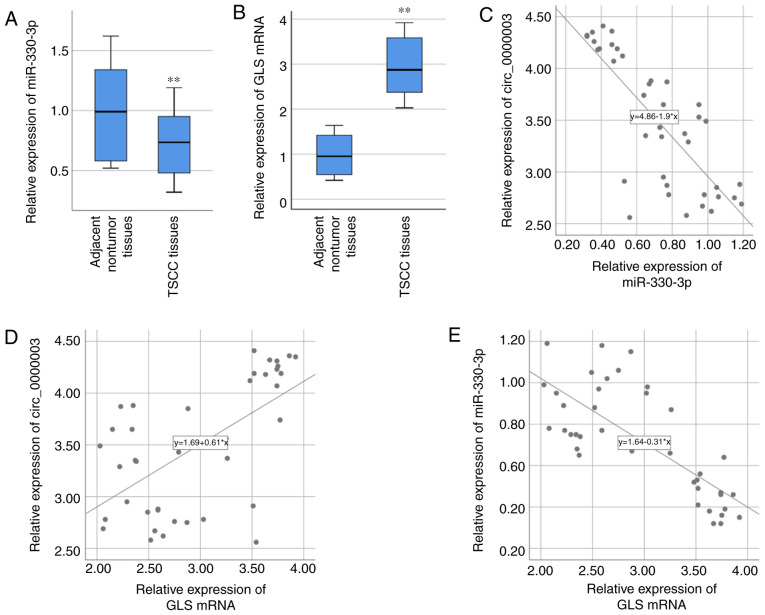
Figure 3.
Correlations between circ_0000003, miR-330-3p and GLS in TSCC. (A) miR-330-3p expression and (B) GLS mRNA expression were detected by RT-qPCR in the TSCC tissues and compared with that in the adjacent nontumor tissues. **P<0.01 vs. the nontumor tissues. (C-E) Bivariate correlation analysis of (C) circ_0000003 and miR-330-3p, (D) circ_0000003 and GLS mRNA, and (E) miR-330-3p and GLS mRNA. circ_0000003, hsa_circ_0000003; GLS, glutaminase; TSCC, tongue squamous cell carcinoma; RT-qPCR, reverse transcription and quantitative polymerase chain reaction.

