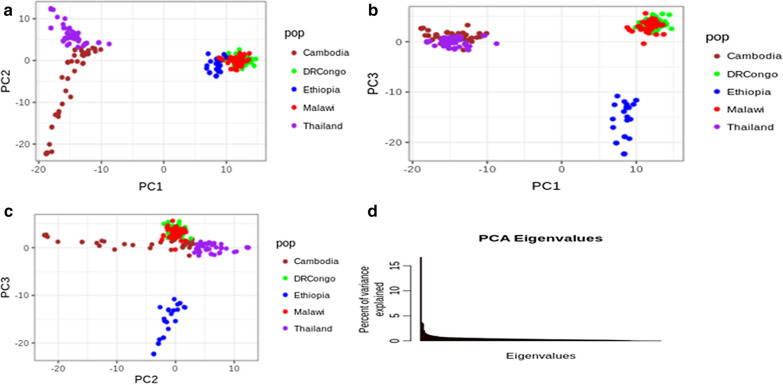
Fig. 2.
Principal component analysis. a Principal component axis1 and axis2 identified Southeast Asian from African P. falciparum population. b Principal component axis1 and axis3 identified Ethiopian, Southeast Asian and other East African P. falciparum populations. c Principal Component axis2 and axis3 identified Ethiopian P. falciparum population from Southeast Asian and African P. falciparum population. d Percent of variance explained by each principal component axis. PC1 explained 16.7%, PC2 explained 3.7% and PC3 explained 3.4% of the variance in the data. Pop stands for the P. falciparum country of origin

