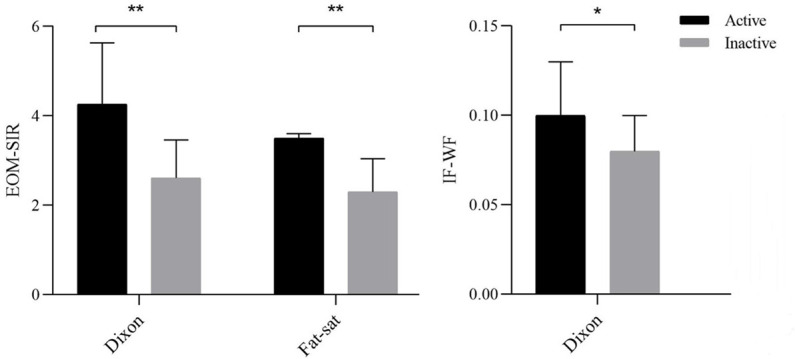
Figure 3.

Bar graph showing the comparisons of quantitative parameters between active and inactive TAOs. An asterisk indicates a significant difference (**p < 0.001, *p < 0.01). EOM, extraocular muscle; IF, intraorbital fat; SIR, signal intensity ratio; TAO, thyroid-associated ophthalmopathy; WF, water fraction.
