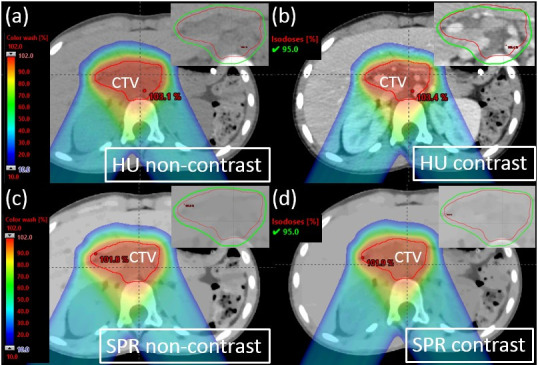
Figure 7.

Proton dose distribution for an example patient (Patient 9) with zoomed-in figures showing 95% isodose line affixed on the right top corner. (a) Optimization plan on non-contrast HU images. (b) Verification plan on contrast HU images. (c) Optimization plan on non-contrast SPR images. (d) Verification plan on contrast SPR images. HU, Hounsfield unit; SPR, stopping-power ratio.
