. 2021 Mar 2:M20-6754. doi: 10.7326/M20-6754

Appendix Figure 2. Calibration curves for predictions of severe illness or death in the next 1 day and 7 days.
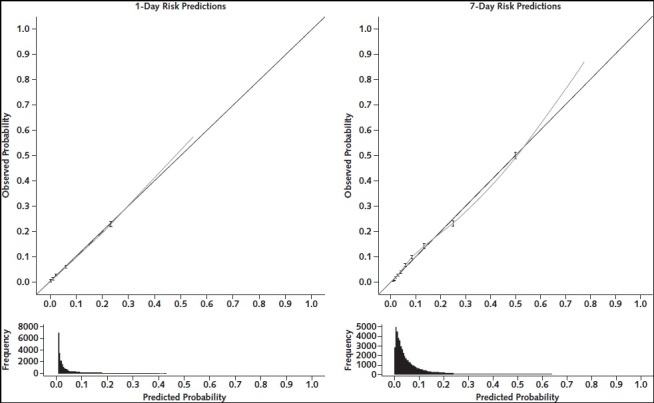
Appendix Figure 2. Calibration curves for predictions of severe illness or death in the next 1 day and 7 days. The points and 95% CIs show calibration by decile. Dashed lines indicate linear fit through the decile points. The dotted line shows the locally weighted smoothing (loess) curve through the predicted probabilities versus observed outcomes. Histograms of the distribution of predicted values are shown below the calibration plots.

The points and 95% CIs show calibration by decile. Dashed lines indicate linear fit through the decile points. The dotted line shows the locally weighted smoothing (loess) curve through the predicted probabilities versus observed outcomes. Histograms of the distribution of predicted values are shown below the calibration plots.