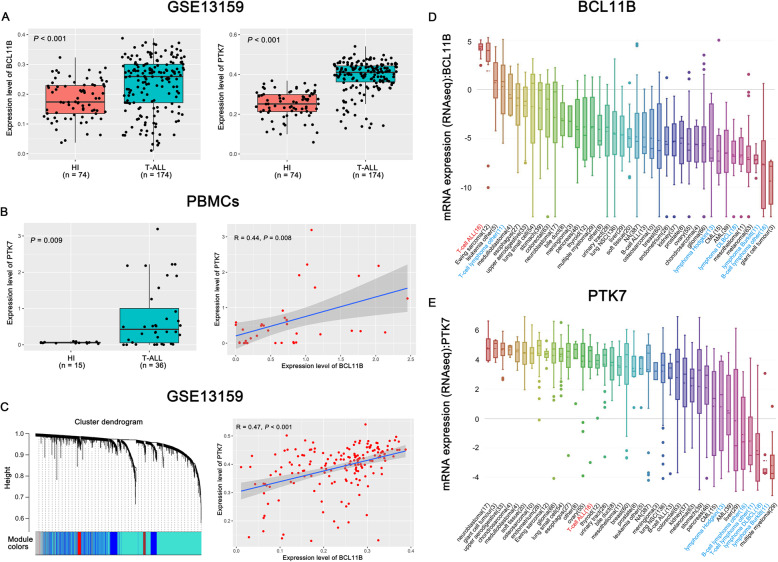
Fig. 1.
Positive correlation between BCL11B and PTK7 in T-cell acute lymphoblastic leukemia (T-ALL). (a) The expression levels of BCL11B (left panel) and PTK7 (right panel) in T-ALL patients and healthy individuals (HIs) in the GSE13159 dataset. (b) Validation of the correlation between BCL11B and PTK7. Expression levels of the PTK7 gene in PBMCs from T-ALL patients and His (left panel). Linear correlation analysis of the BCL11B and PTK7 genes in T-ALL samples (right panel). (c) BCL11B and PTK7 are positively correlated in the GSE13159 dataset. Left panel: co-expression modules were obtained by weighted gene co-expression network analysis (WGCNA). The colored row beneath the dendrogram shows the module assignment determined by the Dynamic Tree Cut. A cluster dendrogram demonstrated that 10,459 differentially expressed genes were enriched in 11 co-expression network modules, while BCL11B and PTK7 were located in the same blue module. Right panel: a positive correlation was detected between BCL11B and PTK7. Both BCL11B (d) and PTK7 (e) are highly expressed in T-ALL compared to lymphoma cell lines. Data were obtained through the Cancer Cell Line Encyclopedia (CCLE). Detailed methods are available in Materials and Methods in Additional file 1

