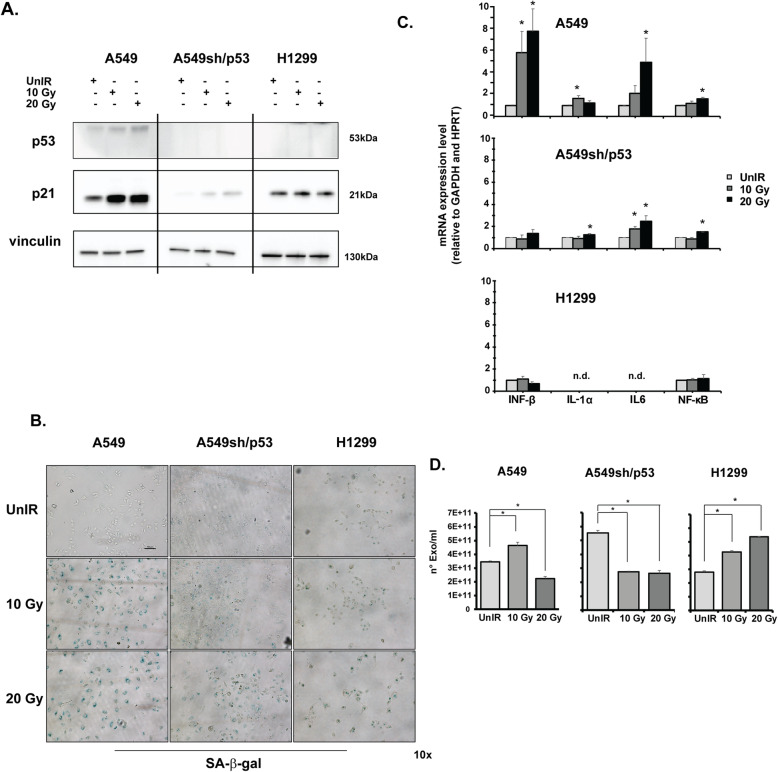
Fig. 2.
P53-dependent SASP induction after irradiation. a P53 and p21 expression in A549, A549sh/p53 and H1299 cells after different radiation doses detected by western blot. The image is representative at least of 2 independent experiments. b Representative images of senescence-associated β-galactosidase (SA-β-gal) staining detected after A549, A549sh/p53, and H1299 cell exposure to 10 or 20 Gy. Scale bar is 100 μm. c mRNA expression of SASP biomarkers using GAPDH and HPRT as housekeeping genes. Data are presented as mean ± SD. d EV quantification using Nanosight nanoparticle tracking analysis. EVs were isolated from the conditioned media of A549, A549sh/p53 and H1299 cells, as described in the Methods section (*p < 0.05)

