Fig. 3.
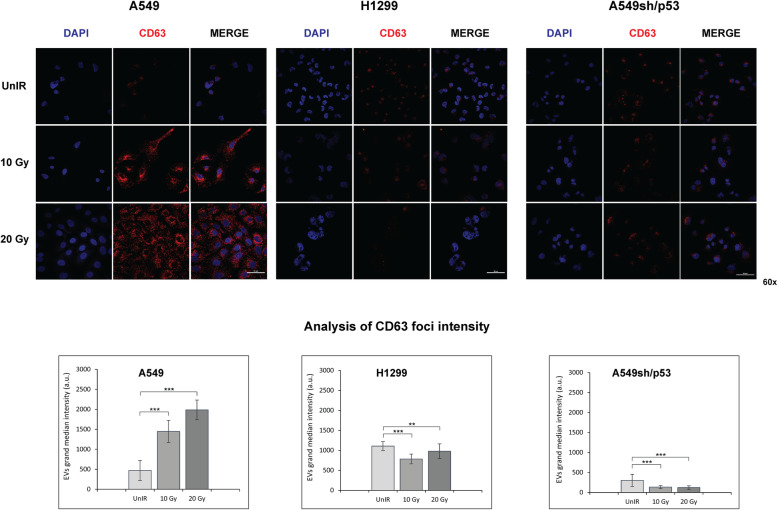
Immunofluorescence staining with CD63 antibody. The images are representative of A549, A549sh/p53 and H1299 cells exposed to different radiation doses. Fluorescent DAPI staining was used to visualize nuclear DNA. The images of the cells were captured by Nikon Eclipse Ti2 confocal microscope with 60x plan apochromatic oil immersion objective lens. Scale bars are 50 μm. Regional foci intensity quantification refers to the evaluation of CD63 expression in A549, A549sh/p53 or H1299 cells exposed to different radiation doses by confocal analysis. The effect of increasing irradiation doses on grand median intensities of nuclear and cytoplasmic foci of DNA:RNA hybrids. Data are presented as grand median ± MAD. (*p < 0.05, **p < 0.01 ***p < 0.001)

