Fig. 2.
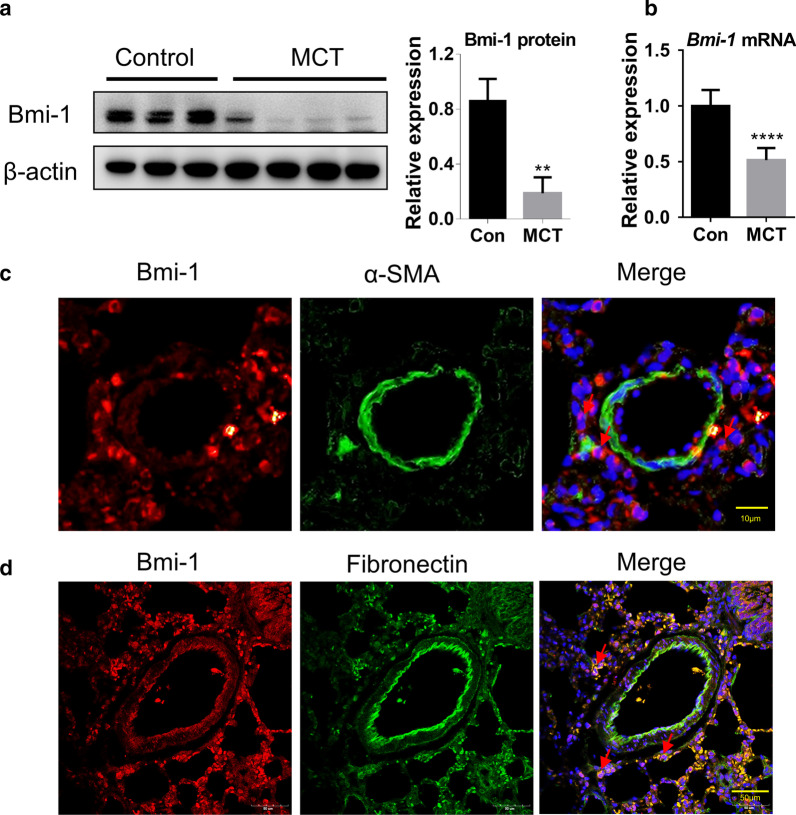
Bmi-1 is mainly expressed in pulmonary adventitial fibroblasts and its expression is reduced in PH rat model. a Western blotting of Bmi-1 from rat lung tissues of control (n = 3) and MCT group (n = 4). b qRT-PCR results of relative mRNA level of Bmi-1//β-actin in lung tissues of each group (n = 3 rats per group). c IF staining for α-SMA and Bmi-1 in the rat lung tissue. Red represents Bmi-1 staining, green represents α-SMA staining, blue represents nuclear DNA staining by DAPI. d IF staining for fibronectin and Bmi-1 in the rat lung tissue. Red represents Bmi-1 staining, green represents fibronectin staining, blue represents nuclear DNA staining by DAPI. All data are shown as the mean ± SEM. Statistical significance was assessed using the unpaired two-tailed Student’s t test: **P < 0.01, ****P < 0.0001

