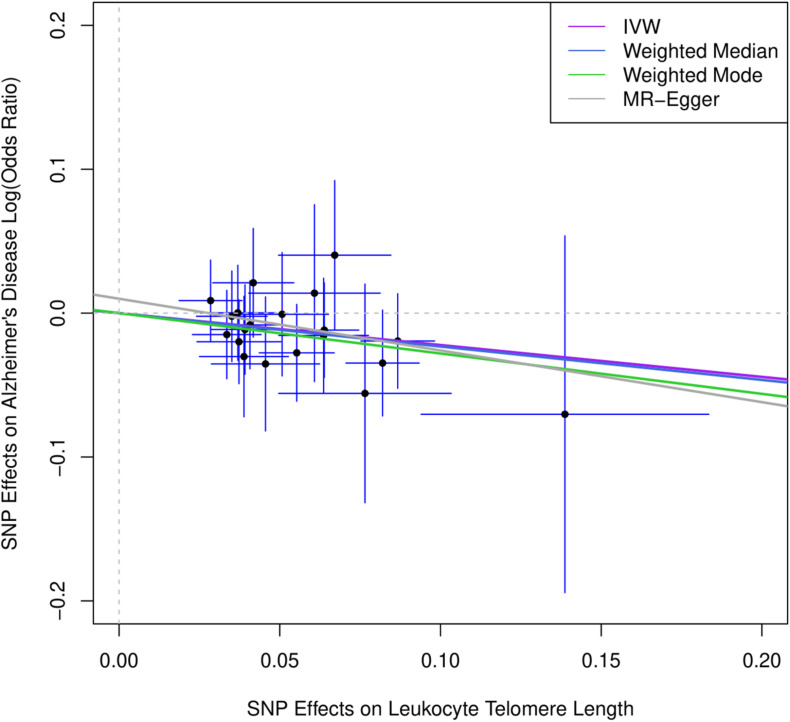
FIGURE 1.
Scatter plot for genetic associations of SNPs on leukocyte telomere length and AD. IVW, inverse-variance weighted; MR, Mendelian randomization. Horizontal axis represents genetic associations of each genetic variant on leukocyte telomere length, and vertical axis denotes genetic associations of each genetic variant on AD.

