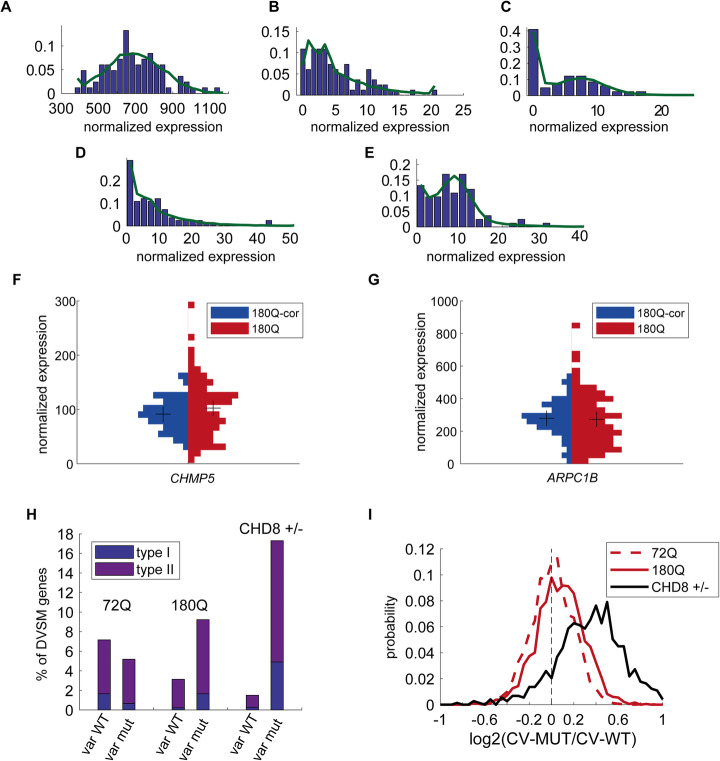
Fig. 3.
Models of neuronal diseases show a global increase in transcriptional variability. Examples of best mixture model fit (see Methods for details) of gene expression distribution. a Pure Gaussian distribution. b Dominant exponential distribution. c A mixture of exponential and “uniform around 0” distributions. d A mixture of exponential and Gaussian distributions. e A mixture of Gaussian and a uniform around 0 (zero-spike) distributions. Green line marks the probability density function of the best fit. f, g CHMP5 and ARPC1B expression is type I and type II more variable in 180Q compared to 180Q-corrected cells, respectively (see Methods for details). Shown are the histogram of the normalized expression values. Black crosses represent the mean expression. h The number of genes which have a similar mean expression in both WT and mutant cells are differentially variable (for details see Methods) in 72Q, 180Q, and CHD8+/− isogenic systems. i The distribution of the log ratio of the CV between mutant and WT for the three isogenic systems. 72Q: dashed red line, 180Q: red solid line, CHD8+/−: black solid line

