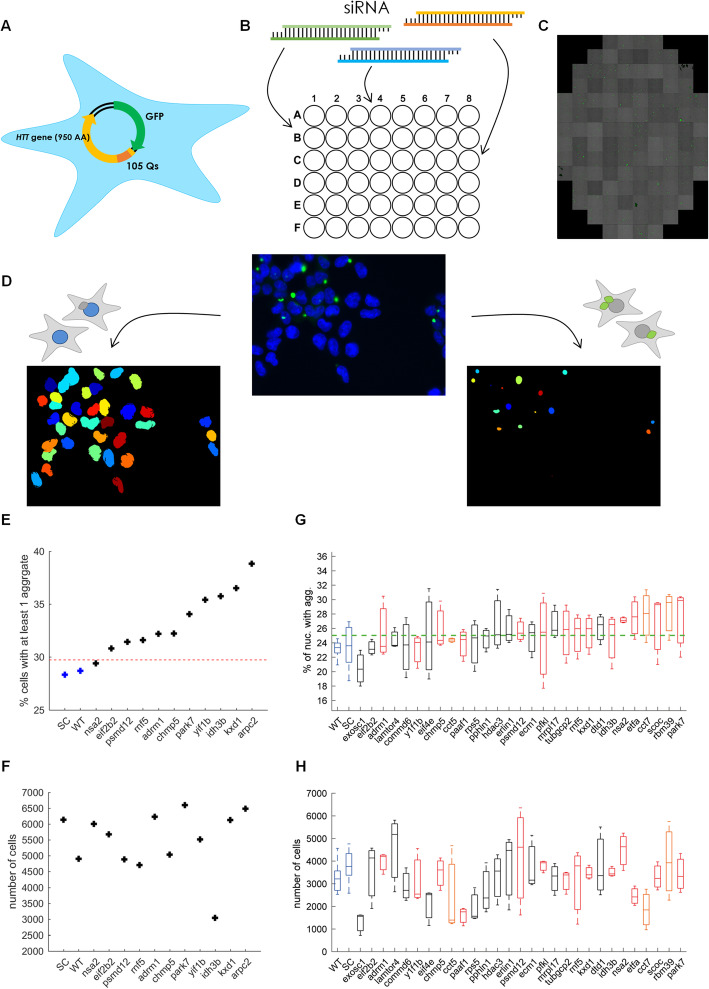
Fig. 5.
Functional validation assay for HD potentially-related genes. a Schematic representation of HEK293 cells and 180Q NPC infected with a GFP-105Q construct. b A heterogeneous population of GFP-105Q cells with 50% of the cells showing aggregates were transfected with siRNAs to knockdown a specific target gene (see Methods). c After 48 (for HEK) or 96 (for NPC) hours, cells were scanned using an automated fluorescent microscope (high content imaging). Aggregates are in green. d Image processing to identify nuclei (bottom left) and aggregates (bottom right). Original images containing both Hoechst-stained nuclei (blue) and polyQ aggregates (green) were segmented separately. e Percentage HEK cells, which have at least one polyQ aggregate, following knockdown of different target genes, listed below. Red dashed line represents the average of 3 standard deviations from the average of non-treated (WT) and scrambled (SC) samples. f Total number of nuclei for each target gene siRNA assay. g, h Same as e and f for NPCs. Red boxes represent DV genes with increased variability in mutant cells, orange boxes represent non-DV genes previously associated with aggregates and black boxes represent control genes. Green dashed line represents the average of 2 standard errors of the mean from the average WT and scrambled samples

