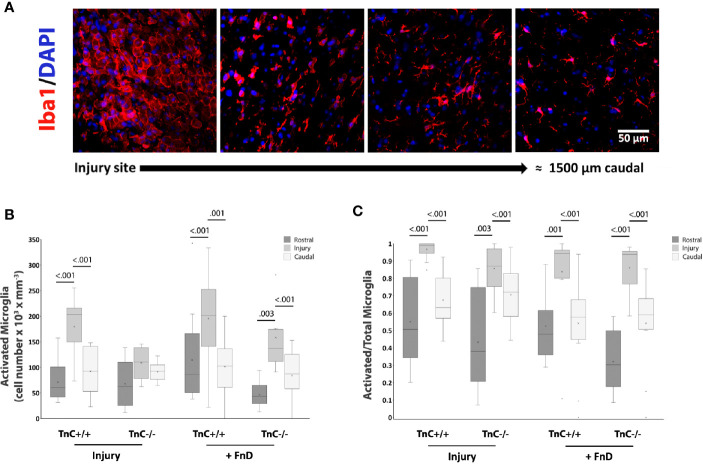
Figure 6.
TnC affects activation of microglia in the injury region. (A) Representative images of Iba1+ and DAPI immunostaining show activated, polygonal microglia framed by astrocytes, at the injury site, and a more quiescent microglia phenotype further away. Calibration bar for all panels: 50 μm. (B) Density of activated microglia by stereo-investigator analysis at the injury region and surrounding rostral and caudal regions of equal size 7 days after injury. Results are shown as a box-and-whisker plot. The effects of genotype and sampling position on the density of activated microglia are significant (p < 0.001), as well as their interaction in the Injury group (p = 0.032) as analyzed by three-way ANOVA. The density of activated microglia in TnC+/+ mice in the injury region is higher in TnC+/+ mice in both Injury and FnD groups compared to the other sampling positions (p < 0.001). FnD application in TnC-/- mice increases the density of activated microglia at the injury region more so than rostrally (p = 0.003) or caudally (p < 0.001. (C) A box-and-whisker plot showing Activated/(Activated + Resting) microglia numbers per region. The proportion of activated microglia is higher at the injury site than rostrally and caudally in the injury and FnD groups of both genotypes (p < 0.001). n = 3 animals per group for each genotype.

