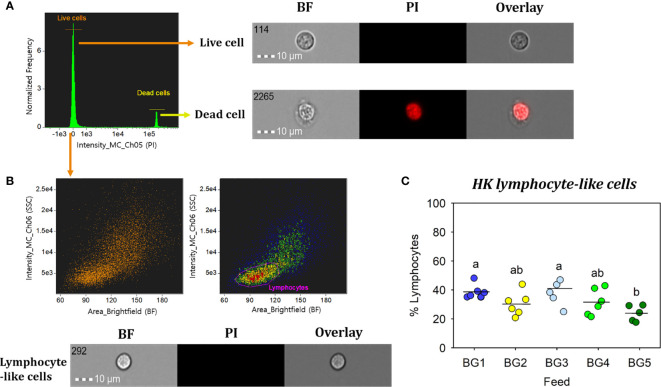
Figure 6.
Percentage of head kidney lymphocyte-like cells from Atlantic salmon fed different experimental diets. BG1: Fishmeal + Fish oil diet; BG2: Soybean meal diet; BG3: Fishmeal + Plant oil diet; BG4: Plant ingredients + Fish oil diet; BG5: Plant ingredients + Plant oil diet. (A) Live cells (orange) were separated by excluding the dead cells (yellow); by staining with propidium iodide (PI). (B) Brightfield (BF) area (cell size) vs. side scatter (SSC) intensity (cell internal complexity) plot showing the HK leucocyte population. (C) Percentage of HK lymphocyte-like cells from fish (n=6) fed different experimental diets. Statistically significant differences (p < 0.05) between dietary groups are indicated by different letters. All cell images were captured with 40× objective. Scale bar = 10 µm. BF, brightfield; PI, propidium iodide.

