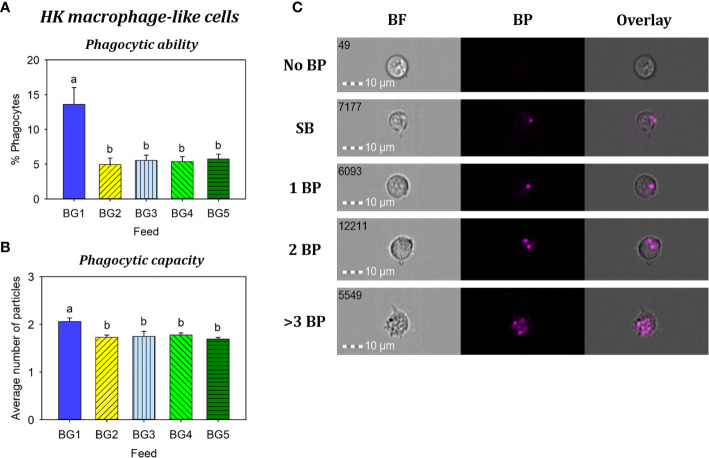
Figure 7.
Phagocytosis of head kidney macrophage-like cells from Atlantic salmon fed different experimental diets. BG1: Fishmeal + Fish oil diet; BG2: Soybean meal diet; BG3: Fishmeal + Plant oil diet; BG4: Plant ingredients + Fish oil diet; BG5: Plant ingredients + Plant oil diet. (A) Percent of phagocytic cells. (B) mean number of particles ingested per phagocytic cell. (C) Representative cell images indicate cells with no BP, SB, and 1BP, 2BP, and >3BP. Statistically significant differences (p < 0.05) between dietary groups are indicated by different letters. Bar plots show mean ± SD, n = 6. All cell images were captured with 40× objective. Scale bar = 10 µm. SB, surface-binding particles; 1 BP, 2 BP, and > 3 BP, one to three internalized bio-particles; BF, brightfield.

