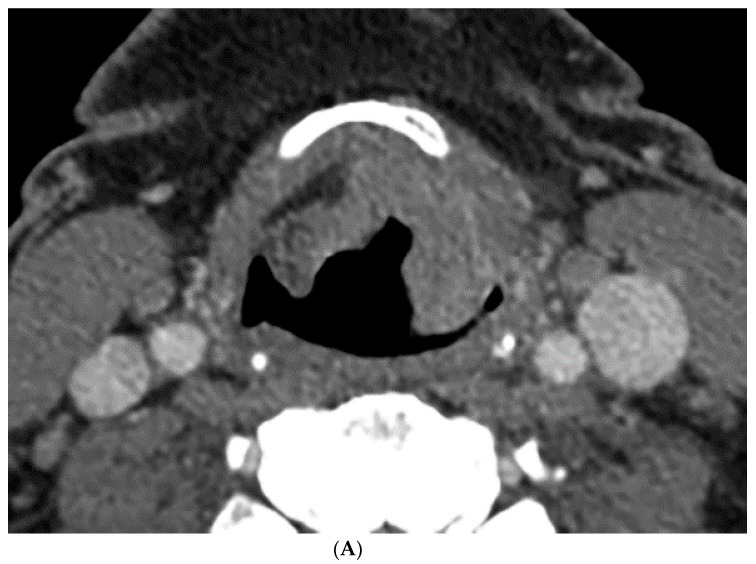
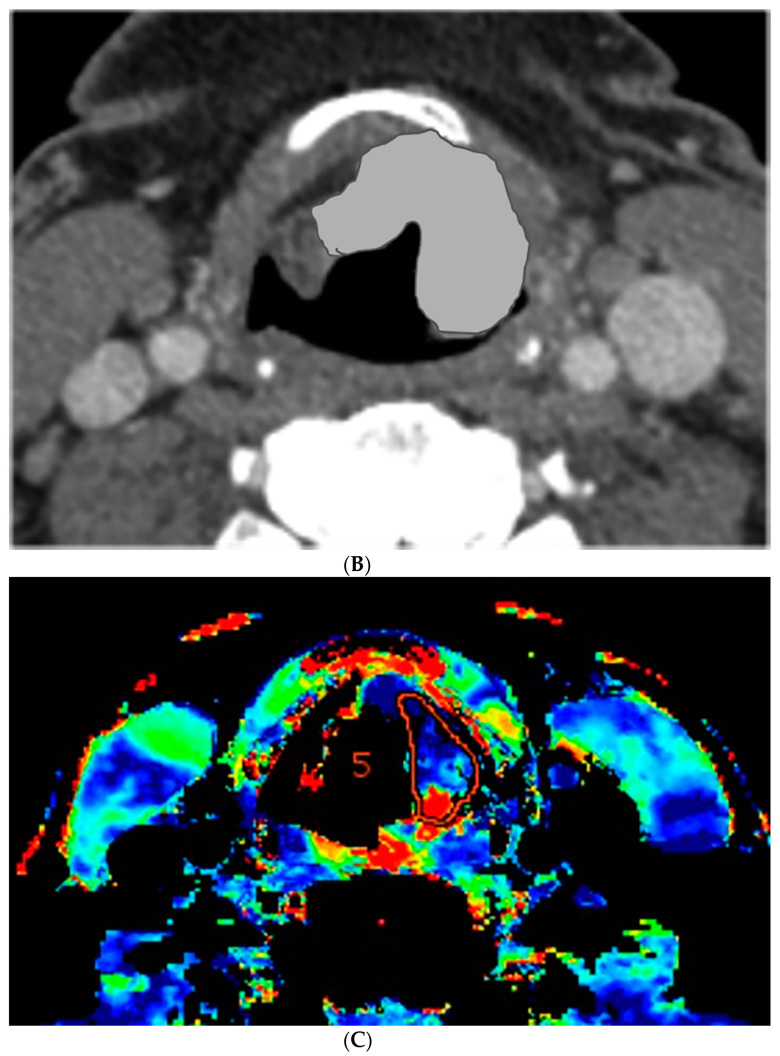
Figure 1.
Computer tomography (CT) and perfusion sections of laryngeal carcinoma on pre-treatment images. Axial sections show the grayscale image (A) and outlines for the following: computer (B) and perfusion image (C). Note that the region of interest (ROI) drawn on the CT perfusion image appears different in size from that on the contrast enhanced image; this is because the CT perfusion images are 5 mm in slice thickness whereas the conventional CT images are 1.25 mm in slice thickness (implying that the CT perfusion data is a composite of 4 adjacent 1.25 mm slices from conventional CT).


