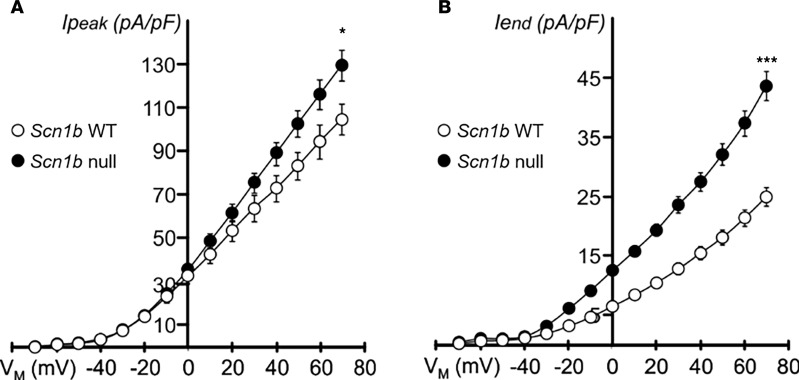
Figure 6. Comparison of current density and voltage dependence of inactivation of peak and end potassium currents.
(A and B) Scn1b deletion results in increased peak (Ipeak) (A) and end (Iend) (B) potassium current densities at depolarized potentials. *P ≤ 0.05, ***P ≤ 0.001 by Student’s t test (assuming equal variances). (A) n = 13 and n = 8 and (B) n = 13 and n = 10 for Scn1b WT and -null, respectively. Data represent mean ± SEM.

