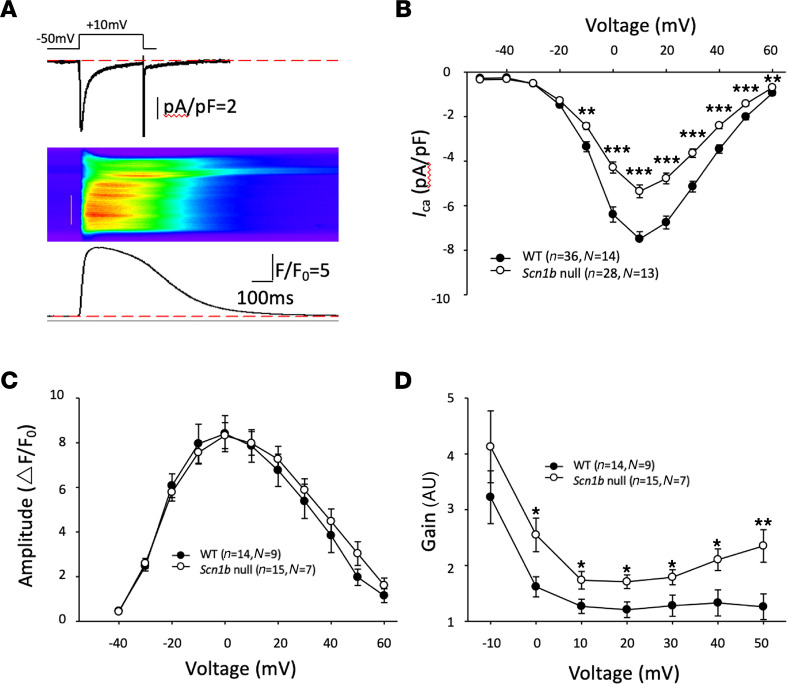
Figure 8. Excitation-contraction coupling in ventricular CMs from Scn1b-null mice.
(A) Representative example of excitation-contraction (E-C) coupling recording. Top: ICa triggered by voltage clamp depolarization; middle: whole-cell Ca2+ transient; bottom: Ca2+ transient time profile. (B) I-V curve shows dramatically decrease of ICa in CMs from Scn1b-null mice. (C) Ca2+ transient amplitude did not change in CMs from Scn1b-null mice compared with WT. (D) E-C coupling gain (ratio between the Ca2+ transient amplitude and the ICa) decreased in CMs from Scn1b-null mice. * P < 0.05; ** P < 0.01; *** P < 0.001. WT vs. Scn1b-null by Student’s t test. N, number of mice; n, number of cells. Data represent mean ± SEM.

