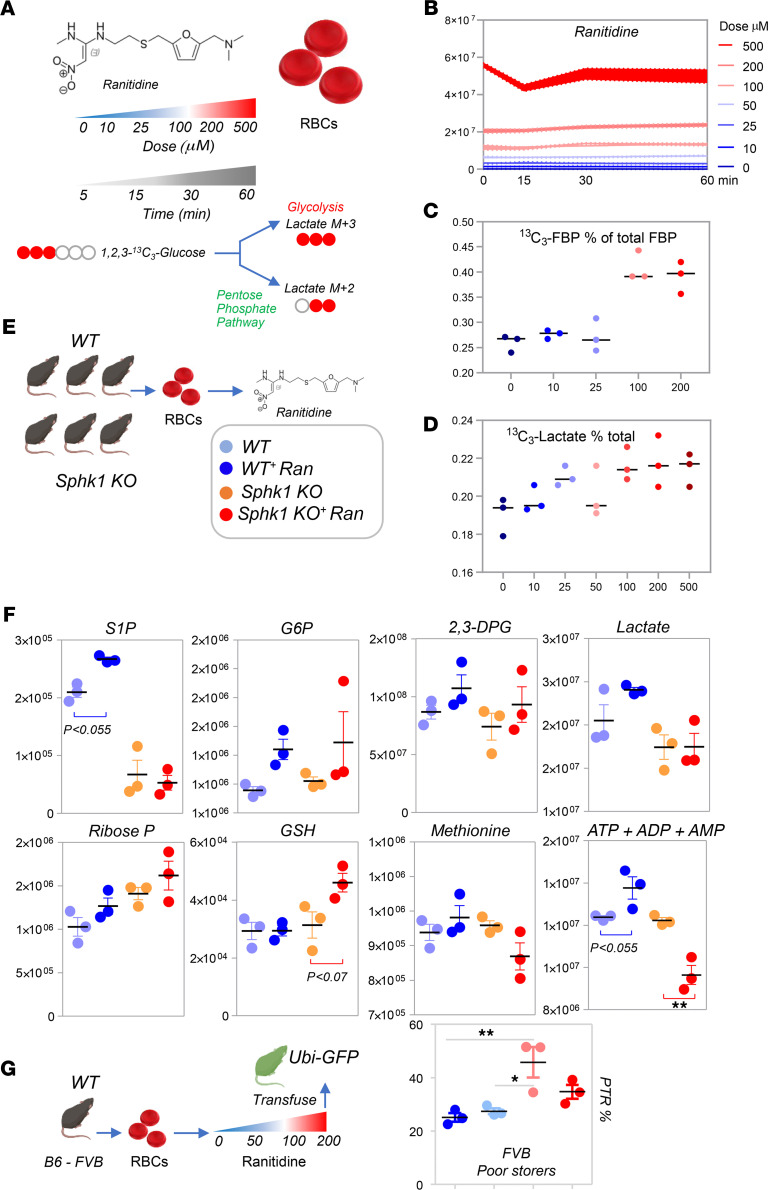
Figure 7. Ranitidine boosts glycolysis in a dose-response fashion in human RBCs.
(A) Human RBCs (n = 3) were incubated with increasing doses of ranitidine in the presence of 1,2,3-13C3-glucose for up to 60 minutes. At increasing doses of ranitidine (B) corresponded increasing levels of 13C3-labeled 1,6-fructose diphosphate (rate-limiting step of glycolysis, plateauing at 100 μM ranitidine; C) and 13C3-lactate (D) — suggestive of increased fluxes through glycolysis but not the Rapoport-Luebering shunt. (E) RBCs were also obtained from 3 WT and 3 Sphk1-KO mice, prior to incubation with 100 μM ranitidine for 60 minutes. (F) After confirming significant decreases in S1P levels in the Sphk1-KO mouse RBCs, we observed that ex vivo incubation with ranitidine promoted increases in the levels of several glycolytic intermediates, including G6P, G3P, 2,3-DPG, phosphoglycerate, and pyruvate. However, increases in the total levels of lactate were observed in WT but not in Sphk1-KO mice following incubation with ranitidine. On the other hand, Sphk1-KO mice showed increased steady-state levels of ribose phosphate, suggestive of increased fluxes through the pentose phosphate pathway and increased NADPH-dependent recycling of glutathione. This observation is consistent with the observed increases in levels of reduced glutathione in Sphk1-KO mice after incubation with ranitidine. These mice were characterized by lower levels of another antioxidant, methionine. (F) Finally, the total adenylate pool (high-energy phosphate compounds including adenosine tri-, di-, and monophosphate [ATP + ADP + AMP]) increased in WT cells following incubation with ranitidine, but decreased in Sphk1-KO mouse RBCs. Color key in E applies to E and F. (G) Storage of RBCs from mice with poor storage quality (FVB, n = 3) in the presence of ranitidine (0, 50, 100, or 200 μM) resulted in significant improvements in RBC storage quality at 100 μM. Colors representing ranitidine doses correspond to the values detailed in B. In A–F, y axes indicate integrated peak areas in AU.

