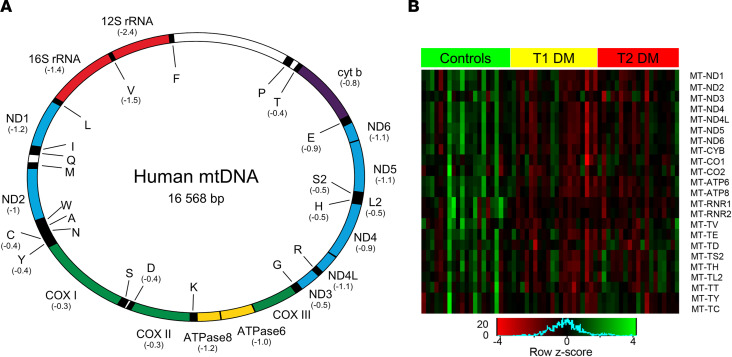
Figure 2. Expression of mitochondrial genes encoded by mitochondrial DNA in DGE (n = 39) versus healthy controls (n = 21).
(A) The mitochondrial genome; log2FC for individual genes that were significantly differentially expressed are in parentheses. (B) A heatmap depicting gene expression (logRPKM+1) values for differentially expressed mtDNA genes in patients with DGE (n = 39) and healthy controls (n = 21). DGE, diabetic gastroenteropathy; RPKM, reads per kilobases per million; mtDNA, mitochondrial DNA.

