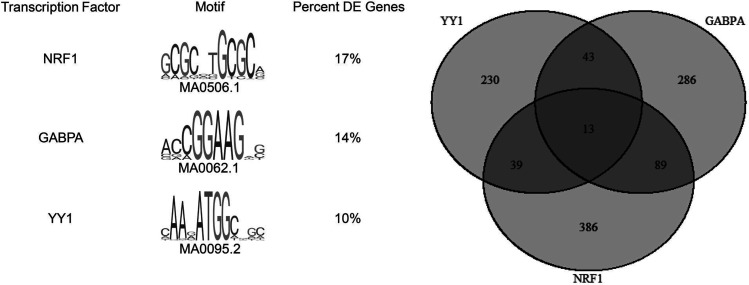
Figure 7. FIMO analysis.
FIMO analysis for NRF1, GABPA, and YY1 in the core promoter sequences of the differentially expressed genes between DGE (n = 39) and healthy controls (n = 21). Venn diagram shows the number of genes (out of the 3175 differentially expressed genes) whose promoters have binding sites for these 3 transcription factors.

