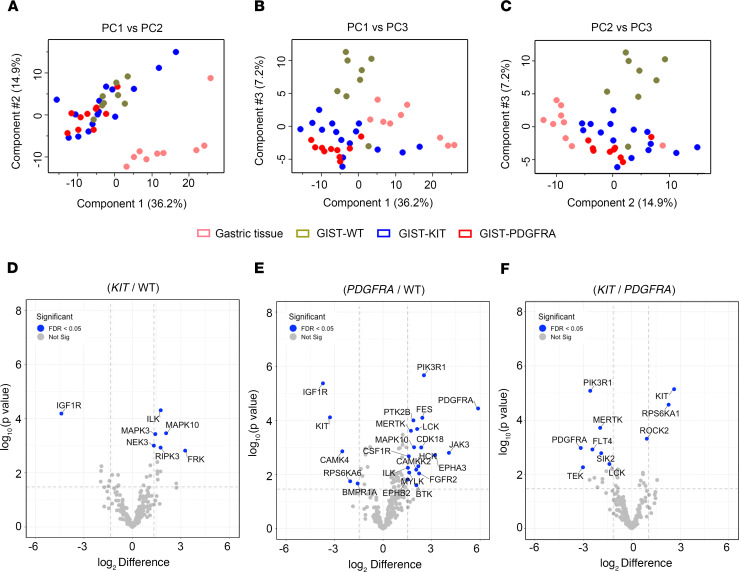
Figure 2. Mapping the distinct kinome signatures among GIST subtypes.
(A–C) PCA, including PC1 vs. PC2 (A), PC1 vs.PC3 (B), and PC2 vs.PC3 (C) of MIB-MS in 3 GIST subtypes (KIT mutant, blue; PDGFRA mutant, red; WT, green) and normal gastric tissue (pink). (D) Volcano plot comparisons of KIT mutant vs. WT, (E) PDGFRA mutant vs. WT, and (F) KIT mutant vs. PDGFRA mutant GIST MIB-MS kinome profiles. Differences in kinase log2 LFQ intensities among tumors and normal tissues determined by paired t test Benjamini-Hochberg adjusted P values at FDR of <0.05 using Perseus software. PCA, principal component analysis; GIST, gastrointestinal stromal tumor; MIB-MS, multiplexed inhibitor beads and mass spectrometry; LFQ, label-free quantitation.

