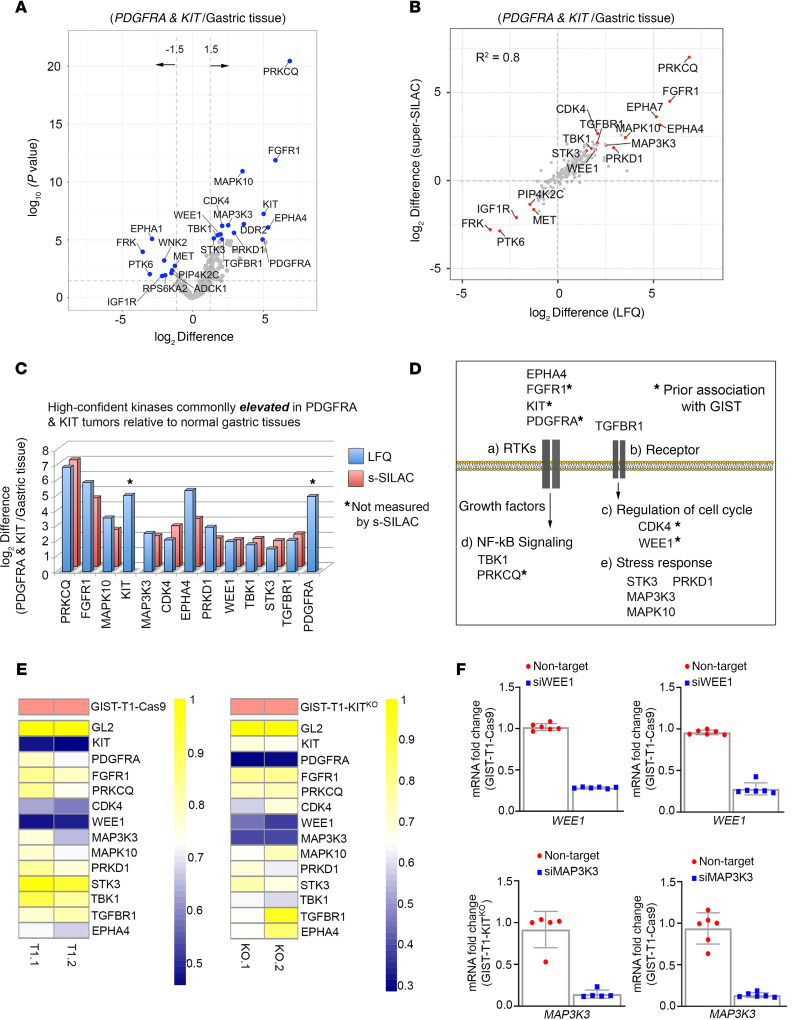
Figure 3. Targeting the mutant-GIST kinome signature identifies WEE1 as candidate target.
(A) Volcano plot comparisons of KIT mutant and PDGFRA mutant GIST vs. normal gastric tissue MIB-MS kinome profiles. Differences in kinase log2 LFQ intensities among tumors and normal tissues determined by paired t test Benjamini-Hochberg adjusted P values at FDR <0.05 using Perseus software. (B) Scatter plot depicts overlap in kinases elevated or reduced determined by LFQ or s-SILAC. Regression analysis (R2) among quantitative methods was performed in Perseus software. Differential expressed kinases commonly identified by LFQ and s-SILAC quantitation (FDR <0.05) are labeled. (C) Bar graph depicts high-confident kinases log2 LFQ z scores overexpressed in mutant-GIST determined by LFQ and/or s-SILAC quantitation (FDR <0.05). (D) Associated pathways/functions of kinases overexpressed in KIT mutant and PDGFRA mutant GIST vs. normal tissues determined by quantitative MIB-MS profiling. (E) Heatmap depicting viability scores for siRNA library screen targeting high-confident kinases elevated in KIT mutant and PDGFRA mutant GIST in GIST-T1+Cas9 and GIST-T1+D842V KITKO cell lines as measured by Cell Titer Blue assay. siGL2 was negative control, viability score = 1.0. Two independent replicates were performed per cell line. (F) Quantitative RT-PCR confirmed >70% knockdown of Wee1 (top) and MAP3K3 (bottom) mRNA in both cell lines. Expression levels were normalized to HPRT. Data represent mean ± SD. GIST, gastrointestinal stromal tumor; MIB-MS, multiplexed inhibitor beads and mass spectrometry; LFQ, label-free quantitation; s-SILAC, super-SILAC.

