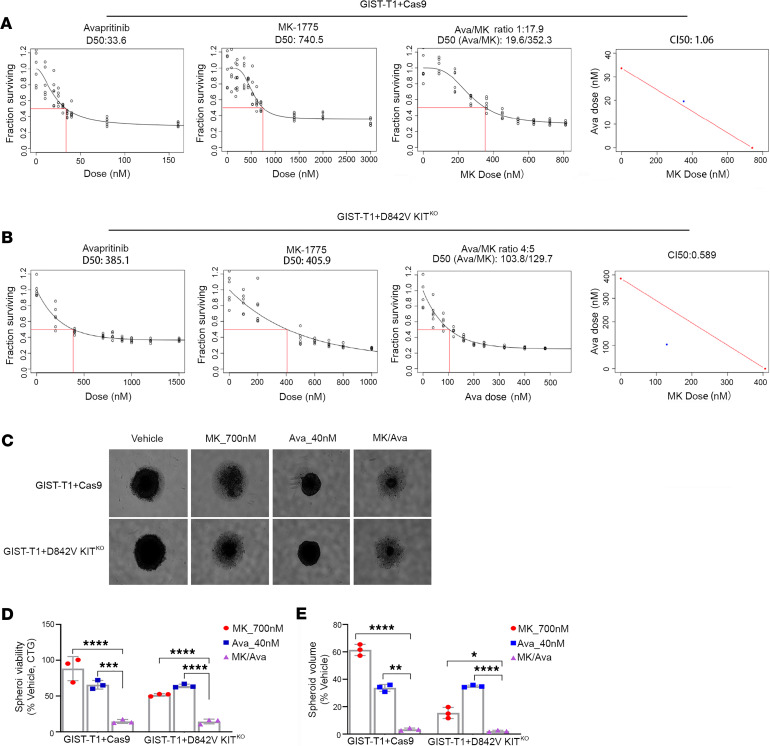
Figure 4. MK-1775 and avapritinib have enhanced combination on in vitro GIST cell growth.
Panels 1 and 2 show dose response curves for single agents (avapritinib, MK-1775) in GIST-T1+Cas9 (A) and GIST-T1+D842V KITKO (B) cell lines. Red box indicates estimation of LD50 concentration for each single drug. Panel 3 shows dose response curve representing increasing series of combinations in GIST-T1+Cas9 (A) and GIST-T1+D842V KITKO (B) cell lines. Red box indicates estimation of LD50 concentration for combination of drugs. Panel 4 shows single point (blue) on isobole curve for 50% kill. Red line indicates 50% isobole for strictly additive effect. CILD50 in GIST-T1+Cas9 is 1.06 and not found in the synergistic triangle (region below the red line) (A). CILD50 is 0.589 in GIST-T1+D842V KITKO and is found within the synergistic triangle (B). Representative images of GIST-T1+Cas9 and GIST-T1+D842V KITKO spheroids after 120-hour treatment at indicated concentrations (C). Bars represent average viability ± SEM after 120-hour treatment at indicated drug concentrations for GIST-T1+Cas9 and GIST-T1+D842V KITKO spheroids as a percentage of vehicle-treated spheroids (D). Bars represent the average spheroid volume ± SEM of GIST-T1+Cas9 and GIST-T1+D842V KITKO spheroids as a percentage of vehicle-treated spheroids (E). All spheroid data were analyzed using GraphPad Prism, with comparisons of treatment groups performed in 1-way ANOVA and post hoc comparisons made using Bonferroni’s multiple comparisons method; *P = 0.0165, **P = 0.0046, ***P = 0.0008, ****P ≤ 0.0001. GIST, gastrointestinal stromal tumor.

