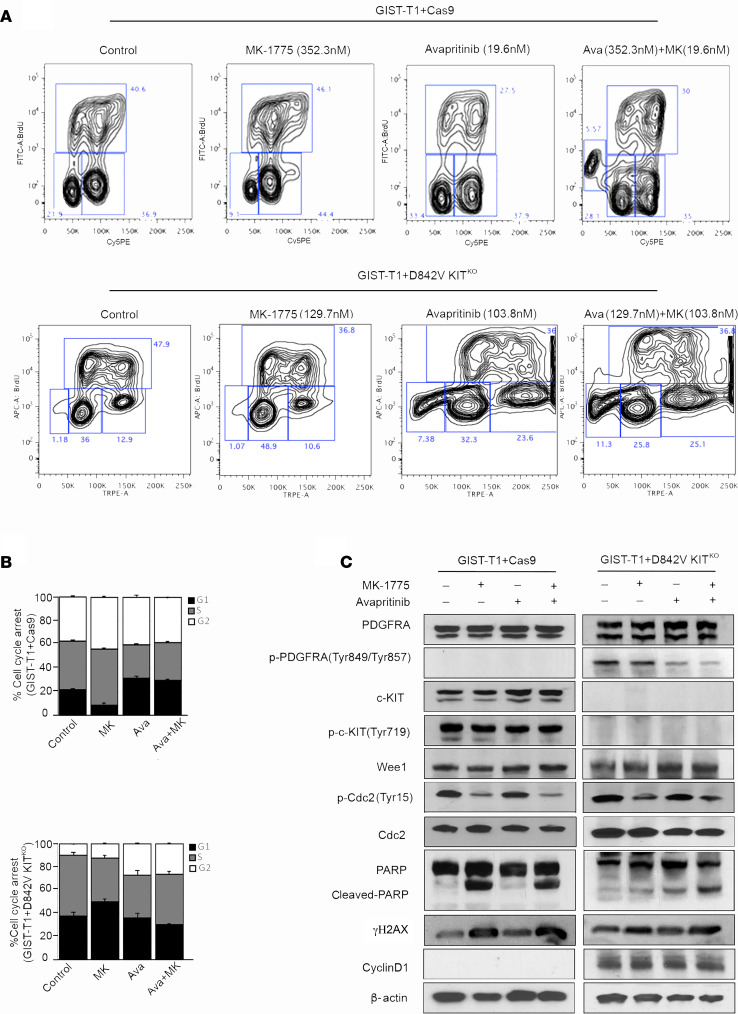
Figure 5. Mechanism of MK-1775 and avapritinib combination in KIT-dependent and –independent GIST cell lines.
(A) Representative flow cytometry plots and (B) quantification of BrdU incorporation in GIST-T1+Cas9 (upper panel) treated with 352.3 nM MK-1775, 19.6 nM avapritinib and combination for 72 hours. Statistically significant differences were observed between the following comparisons: for G1 arrest, vehicle vs. avapritinib (P < 0.0009) and vehicle vs. avapritinib/MK-1775 (P < 0.0002); for G2 arrest, vehicle vs. MK-1775 (P < 0.005). (A) Representative flow cytometry plots and (B) quantification of BrdU incorporation in GIST-T1-D842V+ KITKO treated (bottom panel) with 129.7 nM MK-1775, 103.8 nM avapritinib and combination for 72 hours. Statistically significant differences were observed between the following comparisons: for G1 arrest, vehicle vs. MK-1775 (P < 0.0001); for G2 arrest, vehicle vs. avapritinib (P < 0.005), vehicle vs. avapritinib/MK-1775 (P < 0.0002). Data represent mean ± SD. (C) Immunoblot assays of WCEs from GIST-T1+Cas9 (KIT-dependent) and GIST-T1+D842V KITKO (KIT-independent) cell lines treated as in A and B. Equal concentrations (45–90 μg) of WCE from each sample were subjected to immunoblotting with specific antibodies, as indicated. β-Actin served as a loading control. GIST, gastrointestinal stromal tumor; WCE, whole cell extract.

