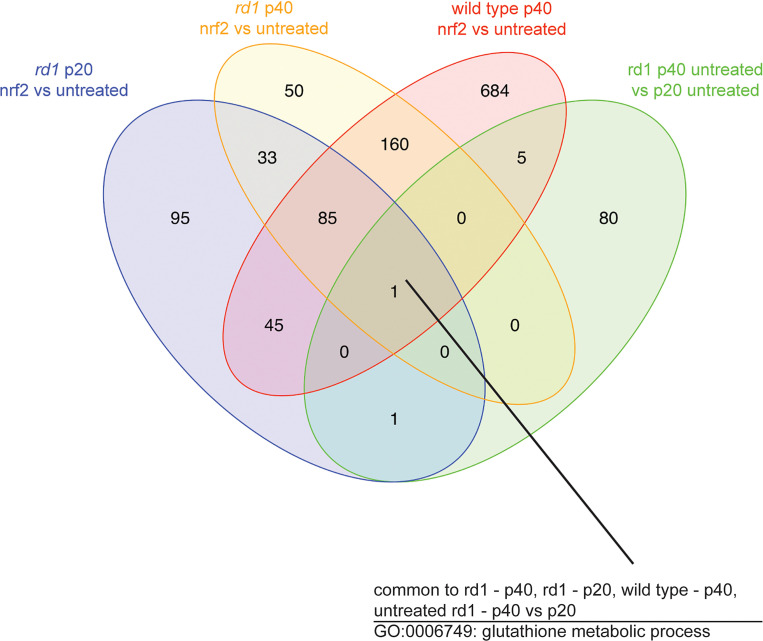
Figure 7. Transcriptional profiling of RPE from WT and rd1 mice with or without overexpression of Nrf2.
Venn diagram showing the number of gene ontology (GO) terms for biologic processes overrepresented in each comparison and the number of biological processes shared across the different comparisons. The number within each overlapped area denotes the number of shared biological processes between each overlapped comparison. A single GO term, glutathione metabolism, was overrepresented in all comparisons (all 3 comparisons that involved Nrf2 overexpression, as well as untreated P20 versus P40 rd1 mice) (n = 6 mice for p20, 4 mice for p40 rd1, and 5 mice for p40 WT)

