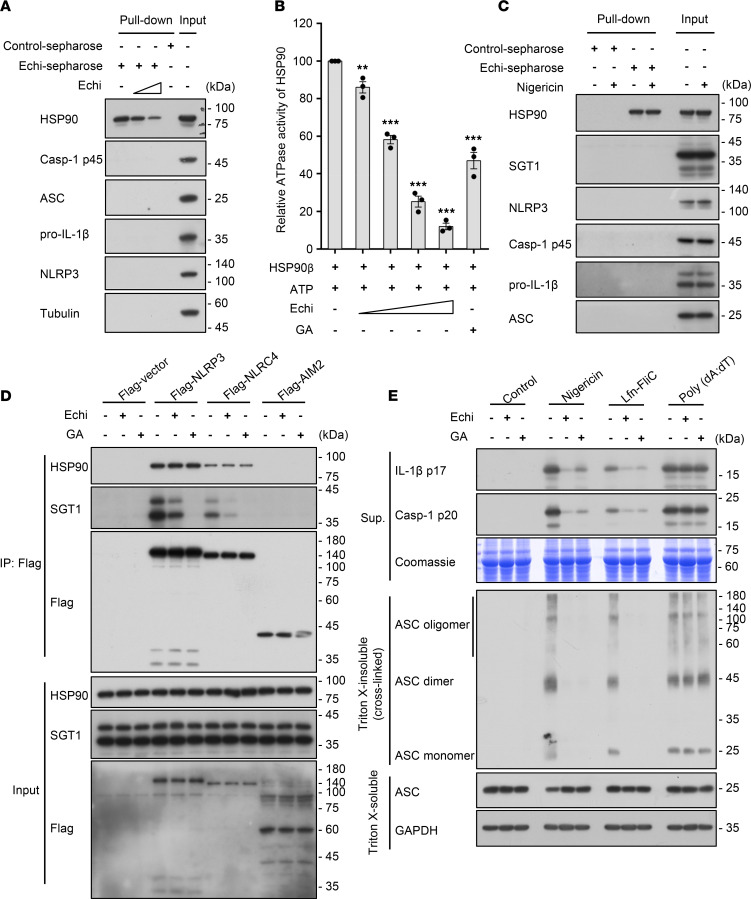
Figure 4. Echinatin binds to HSP90 and inhibits its ATPase activity.
(A) Cell lysates of LPS-primed BMDMs incubated with echinatin-sepharose and different concentrations of free echinatin (0.4 mM and 0.8 mM). The pull-down samples and input were analyzed by IB. (B) Effect of echinatin on the ATPase activity of HSP90β. After incubation HSP90β plus indicated different concentrations of free echinatin (0.25 mM, 0.5 mM, and 1 mM) and geldanamycin (GA, 20 μM), ATP was measured by CellTiter-Glo and normalized to the control. (C) Cell lysates of LPS-primed BMDMs with or without nigericin incubated with echinatin-sepharose. The pull-down samples and input were analyzed by IB. (D) 293T cells were transfected with indicated plasmids and then treated with vehicle, echinatin (80 μM), and GA (20 μM). Immunoprecipitation was performed with anti–Flag M2 agarose beads; the IB for HSP90, SGT1, and Flag is shown. (E) LPS-primed BMDMs were pretreated with vehicle, echinatin (40 μM), or GA (20 μM) and then stimulated with nigericin, Lfn-FliC, or poly(dA:dT). Cleaved caspase-1, production of IL-1β, and cross-linked ASC in the Triton X–insoluble pellet were examined by IB analysis. Data are expressed as mean ± SEM (n = 3/group, resulting from 3 independent experiments). One-way ANOVA, followed by Dunnett’s post hoc test, was used to assess the differences of multiple groups (B), **P < 0.01, ***P < 0.001 compared with control.

