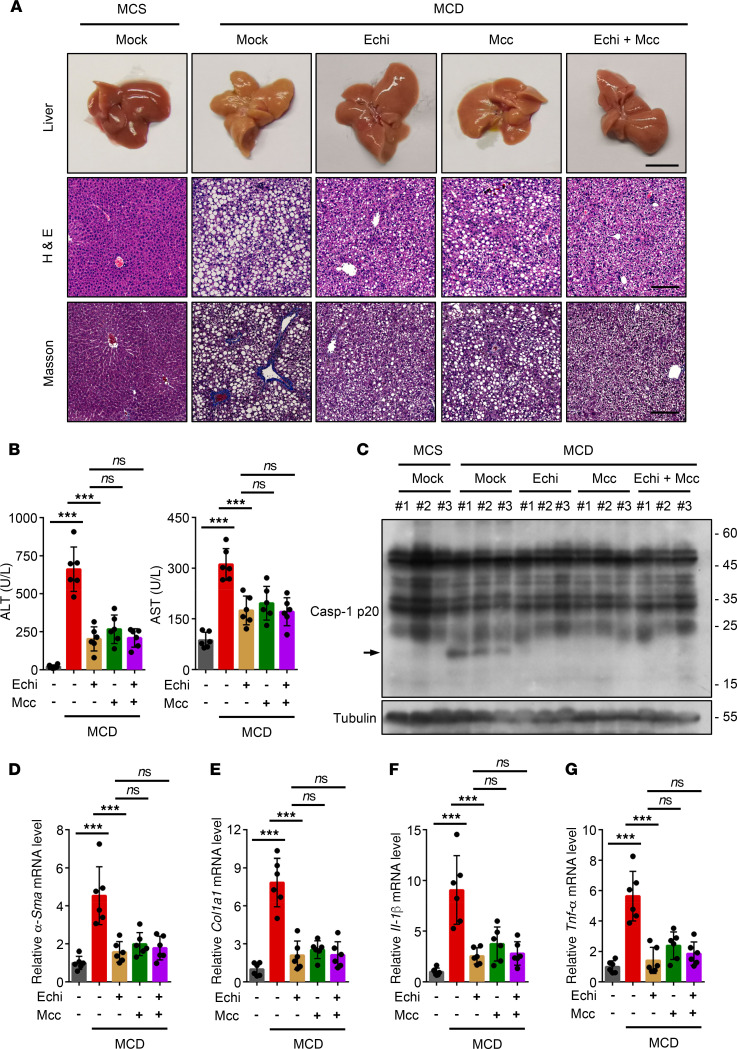
Figure 7. Echinatin exhibits therapeutic effect in nonalcoholic steatohepatitis (NASH) model.
(A) Representative liver images, H&E-stained, and Masson-stained liver sections are shown from the mice fed MCD or MCS diets in the presence or absence of echinatin (Echi; 40 mg/kg), MCC950 (40 mg/kg), or Echi plus MCC950. Scale bar: 1 cm (top row), 200 μm (bottom 2 rows). (B) The activity of plasma ALT and AST were measured as described in A (n=6 for each group). (C) Representative IB analysis of active caspase-1 level in liver tissues described in A. (D–G) Hepatic α-Sma (D), Col1a1 (E), Il-1β (F), and Tnf-α (G) mRNA were measured from the mice described in A (n=6 for each group). Data are expressed as mean ± SD. One-way ANOVA, followed by LSD post hoc test, was used to assess the differences of multiple groups (B and D–G). ***P < 0.001.

