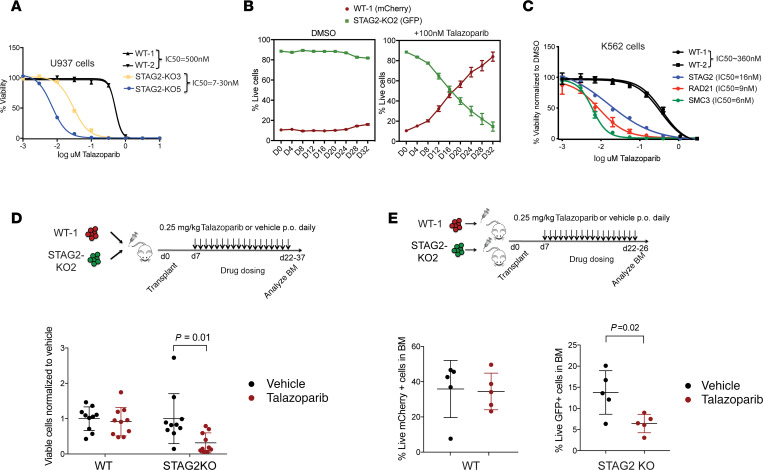
Figure 2. STAG2-mutant AML cell lines are more sensitive to PARP inhibition in vitro and in vivo.
(A) Drug dose response curves of WT and STAG2-mutant U937 cell lines treated with the PARP inhibitor talazoparib. U937 WT-1, WT-2, STAG2 KO-3, and STAG2 KO-5 cells were used for this experiment. IC50 was calculated on day 12 of treatment. Error bars represent SD of measurements of triplicate technical replicates. (B) Competition assay with WT (U937 WT-1-mCherry) and STAG2-knockout (U937 STAG2-KO2-GFP) cells mixed in 1:10 ratio in the presence of DMSO or talazoparib (100 nM) in vitro. Error bars represent SD of measurements of triplicate technical replicates. (C) Drug dose response curves of WT and STAG2-, SMC3-, and RAD21-mutant K562 clones treated with talazoparib. IC50 was calculated on day 12 of treatment. Error bars represent SD of measurements of 3 technical replicates. (D) Schematic of the in vivo drug treatment of WT and STAG2KO xenografts. WT (U937 WT-1-mCherry) and STAG2-knockout (U937 STAG2-KO2-GFP) cells were mixed 1:1 and transplanted into NOD/SCID IL-2Rγ null Tg(IL3, CSF2, KITL) (NSGS) recipients and dosed with talazoparib or vehicle by oral gavage at 0.25 mg/kg once a day. Percentage of live GFP+ or mCherry+ cells in the bone marrow was determined using flow cytometry. Mean ± SD is shown. P = 0.01 (Student’s t test). n = 10 mice per group. (E) Schematic of the in vivo drug treatment of WT and STAG2-knockout xenografts. WT (U937 WT-1 mCherry) or STAG2-knockout (U937 STAG2-KO2-GFP) cells were transplanted into NSGS recipients and dosed with talazoparib or vehicle by oral gavage at 0.25 mg/kg once a day. Percentage of live GFP+ or mCherry+ cells was determined using flow cytometry. Mean ± SD is shown. P = 0.02 (Student’s t test). n = 5 mice per group.

