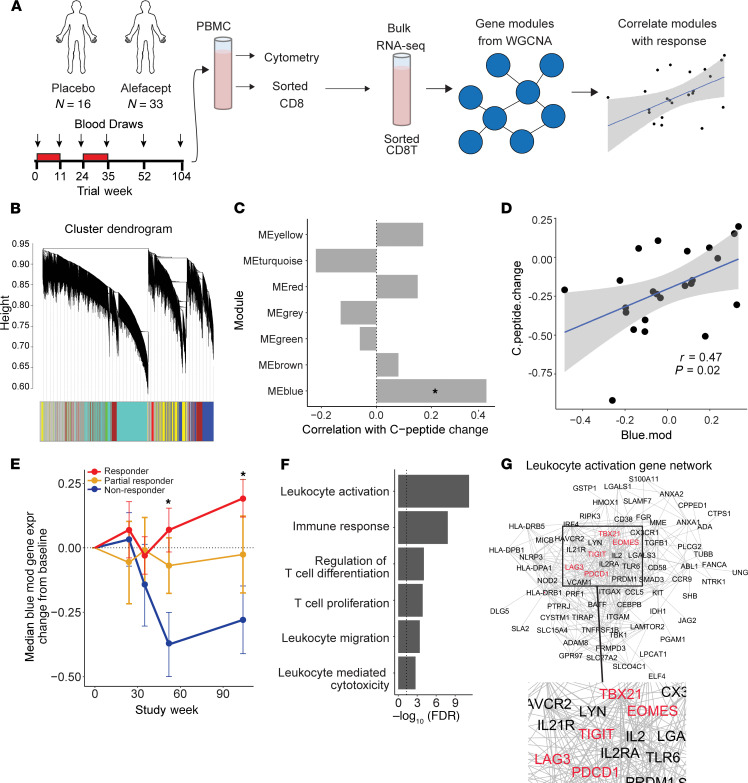
Figure 1. CD8+ T cell activation and exhaustion-associated gene signature was associated with response to alefacept.
(A) Schematic diagram shows analysis workflow. (B) WGCNA cluster dendrogram is shown for analysis of 5000 most variable genes in CD8 samples (n = 24; including 2 placebo). (C) Pearson correlation between module eigengene and C-peptide change. Significance of correlation was determined by Student’s asymptotic 2-tailed t test. Only the blue module was significantly correlated with C-peptide change (*P < 0.05). Correlation and significance calculations included all 24 subjects used for WGCNA module generation. (D) Graph shows blue module eigengene expression versus C-peptide change at week 104 across the same 24 subjects (r = 0.47, P = 0.023, FDR = 0.14). Pearson correlation and the corresponding 1-tailed t test of correlation significance were performed using cor.test function in R. (E) Change from baseline median expression of blue module genes in responders, partial responders, and nonresponders over time. See Supplemental Table 1 for sample numbers per group and visit. Significant differences at week 52 and 104 were seen between responders and nonresponders (*P < 0.05). Significance was determined by repeated-measures 1-way ANOVA, with multiplicity adjustment applied to P values. (F) A selection of significantly enriched terms identified by GO enrichment analysis of blue module genes are shown with their respective enrichment P value (–log10[FDR]). (G) Blue module genes categorized as “leukocyte activation” by GO analysis were clustered using string (string-db.org) and visualized in Cytoscape. Inhibitory marker names colored red.

