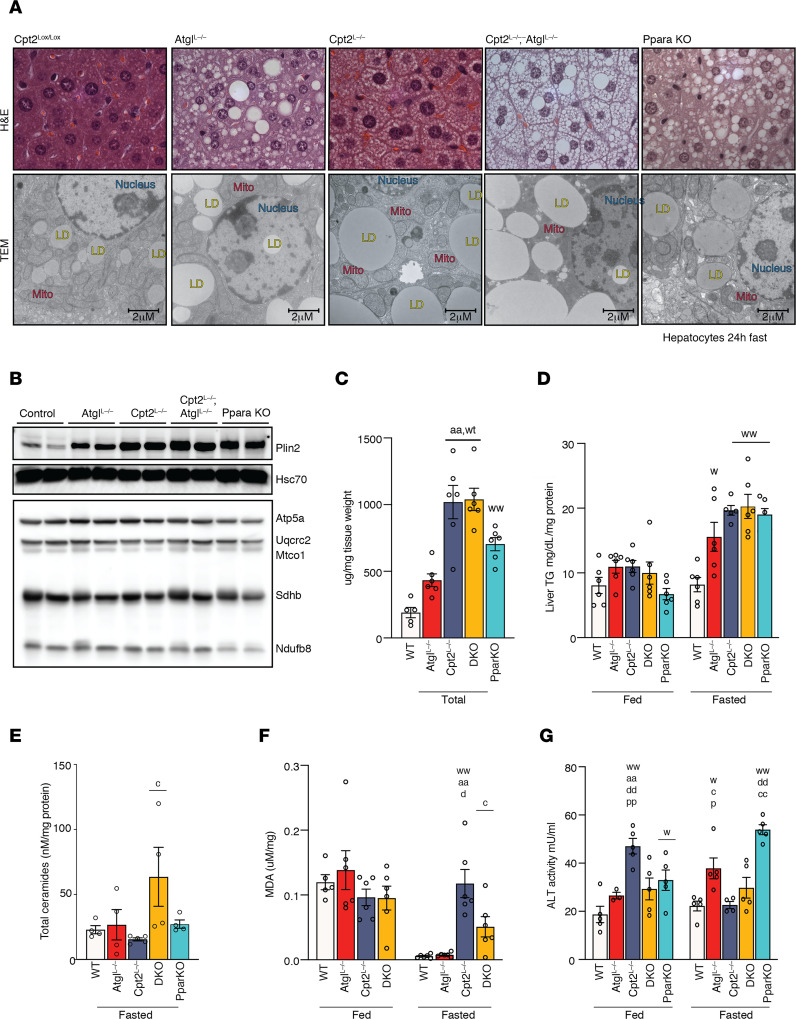
Figure 3. Loss of individual components of fatty acid catabolism results in unique hepatocyte morphology.
(A) H&E staining and transmission electron micrographs of livers from 24-hour fasted control, AtglL–/–, Cpt2L–/–, DKO, and Pparα-KO mice. (B) Western blot of oxidative phosphorylation (OXPHOS) complexes in livers of all genotypes. (C) Total liver fatty acid measurements from all genotypes (n = 6). (D) Triglyceride content of liver from mice under fed and fasting conditions (n = 6). (E) Total ceramides from all genotypes (n = 4). (F) Lipid peroxidation in livers of fed and fasted mice measured using thiobarbituric acid reactive substances (TBARS) assay (n = 6). (G) Liver damage assessed by serum ALT activity of fed and 24-hour-fasted animals and represented as fold changes relative to control (n = 5). One- or 2-way ANOVA followed by Tukey’s multiple-comparison test were performed where appropriate to detect significance between genotypes. Single letter denotes P < 0.05. Double letters denote P < 0.01. Letters w (control), a (Atgl), c (Cpt2), d (DKO), and p (Pparα) represent significance between the genotypes. Data are shown as mean ± SEM. Females were used in A and males in B–G. MDA, malondialdehyde.

