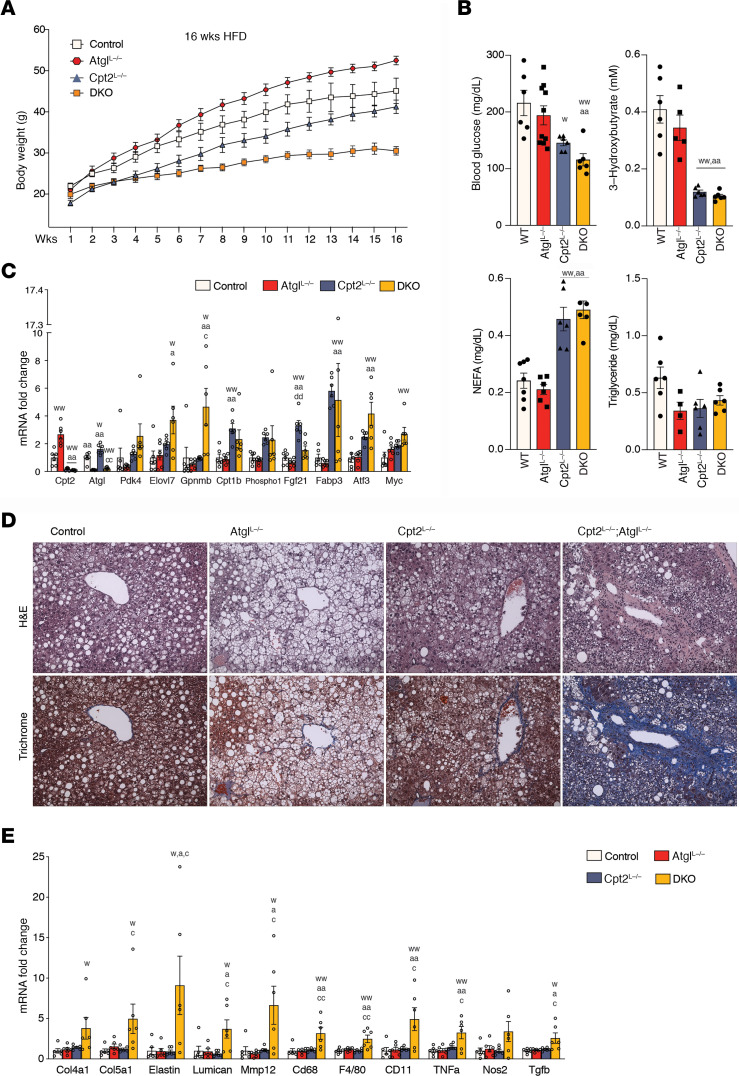
Figure 5. Combined defects in TG hydrolysis and fatty acid oxidation lead to HFD-induced NASH.
(A) Body weights of control, AtglL–/–, Cpt2L–/–, and DKO male mice fed an HFD for 16 weeks (n = 9–14). (B) Serum glucose, 3-hydroxybutyrate, NEFA, and TG concentrations of 16-week-old male HFD mice (n = 6). (C) HFD dramatically altered selected genes in liver of male mice. Gene expression represented as in fold changes relative to control (n = 6). (D) Histological morphology of the livers was assessed by H&E and trichrome staining. (E) HFD effect on inflammatory and fibrosis genes in livers of male mice. Gene expression represented as in fold changes relative to control (n = 6). One-way or 2-way ANOVA followed by Tukey’s multiple-comparison test were performed where appropriate to detect significance between genotypes. Single letter denotes P < 0.05. Double letters denote P < 0.01. Letters w (control), a (Atgl), c (Cpt2), d (DKO), and p (Pparα) represent significance between the genotypes. Data are shown as mean ± SEM.

