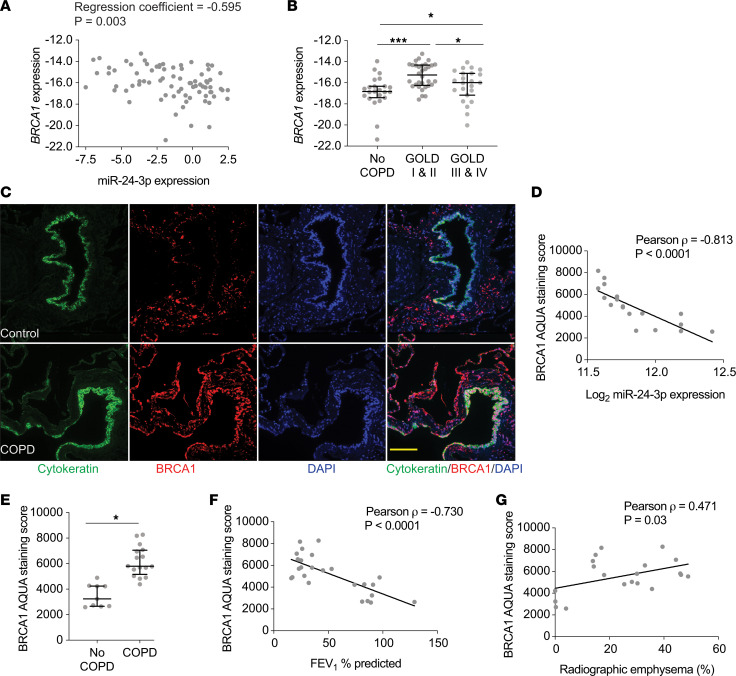
Figure 7. BRCA1 expression inversely correlates with miR-24-3p expression and BRCA1 is increased in COPD.
(A) Correlation of BRCA1 expression (ΔCt BRCA1/18S) and miR-24-3p expression (ΔCt miR-24-3p/RNU48) measured by RT-PCR in lung tissue samples from the confirmatory cohort (n = 78). The regression coefficients and P values are adjusted for the effects of age, sex, and smoking status. (B) BRCA1 expression (ΔCt BRCA1/18S) measured by RT-PCR in lung tissue samples from the confirmatory cohort. n = 23 for no COPD, n = 32 for GOLD I & II COPD, and n = 23 for GOLD II & IV COPD. (C) Representative images showing in situ detection of BRCA1, cytokeratin, and DAPI nuclear stain. BRCA1 staining intensity within the image mask generated from the cytokeratin and DAPI-positive staining was used to generate a quantitative score of BRCA1 staining using automated quantitative analysis (AQUA). Yellow scale bar: 50 μm. (D) Pearson correlation between miR-24-3p expression and BRCA1 AQUA staining scores (n = 19). (E) BRCA1 AQUA staining scores from control (n = 9/group) and COPD subjects (n = 16/group). (F) Pearson correlation between FEV1 percent predicted and BRCA1 AQUA staining scores (n = 25). (G) Pearson correlation between percent radiographic emphysema and BRCA1 AQUA staining scores (n = 21). Error bars represent median ± IQR (B) or mean ± SEM (E). ***P ≤ 0.0001, *P < 0.05 Kruskal-Wallis (B) or Student’s t test (E) correcting for multiple comparisons using the 2-stage linear step-up procedure of Benjamini, Krieger, and Yekutieli.

