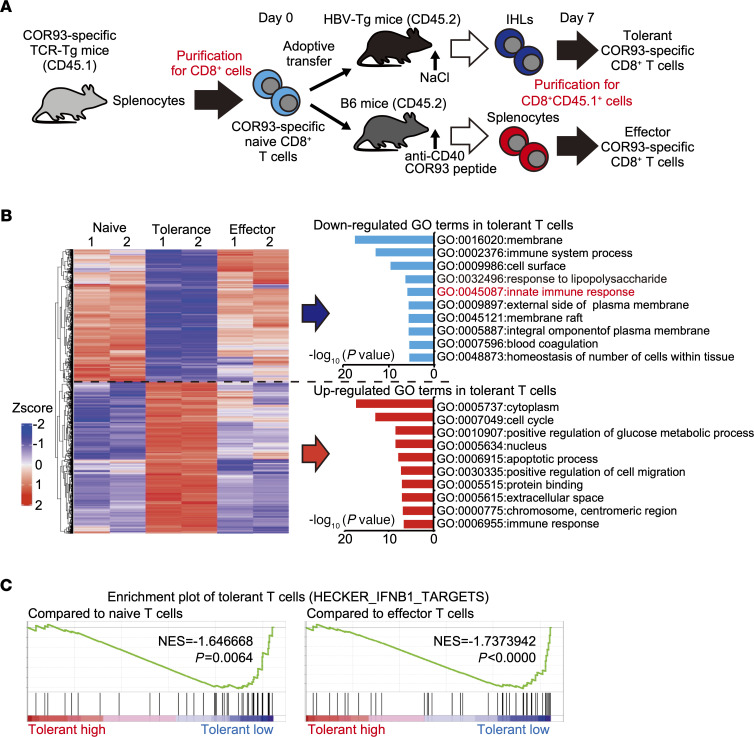
Figure 1. Gene expression profile of intrahepatically primed dysfunctional CD8+ T cells.
(A) Schematic representation of the experiment. (B) Left panel: a heatmap of the gene expressions uniquely downregulated or upregulated in tolerant T cells compared with naive and effector T cells (n = 2 for each group). Gene ontology (GO) analysis of the down- and upregulated gene sets was performed, and the top 10 GO terms of each set are shown in the right panel. (C) Enrichment plots of IFN-I–related gene set (HECKER_IFNB1_TARGET) in tolerant T cells compared with naive (left) or effector (right) T cells.

