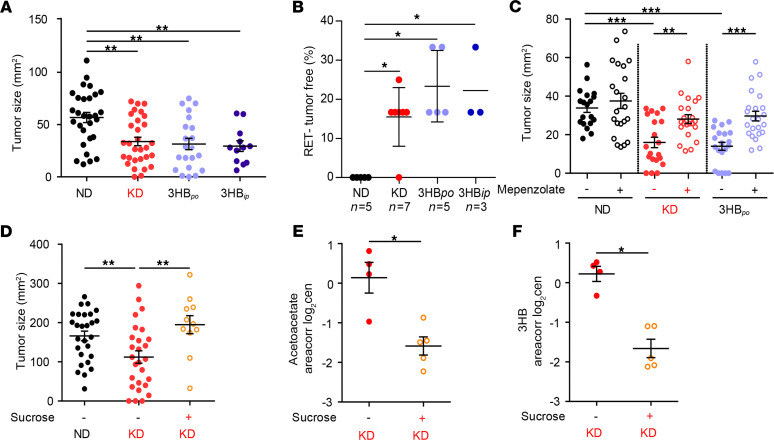
Figure 3. Ketone body 3-hydroxybutyrate (3HB) is necessary and sufficient to account for the anticancer effects of ketogenic diet.
(A and B) Similar experimental setting as in Figure 1, A and B, comparing RET tumor size at day 12 of each nutritional intervention (normal diet [ND], ketogenic diet [KD], 3-hydroxybutyrate per os [3HBpo] versus 3-hydroxybutyrate i.p. [3HBip]) for all 12–15 mouse tumors from 3 independent experiments (A) and the complete regression rates for all the experiments performed (n, number of independent experiments encompassing 5–6 mice/group, SEM of percentage of tumor free mice across 3–7 experiments) (B). (C) Pharmacological inhibition of GPR109A (versus PBS as control) using i.p. daily administration of mepenzolate bromide (C21H26BrNO3). Tumor sizes at day 12 are depicted for each group. Data from 2–3 experiments involving 5–6 mice/group are depicted (n = 20 for ND, KD, and 3HBpo without mepenzolate and n = 24 for ND, KD, 3HBpo + mepenzolate. (D–F) Effects of sucrose supplementation on the antitumor (D) and metabolic effects (E and F) mediated by KD. Id. as in Figure 1, A and B, showing RET tumor sizes at day 12 after various dietary interventions (D) and the 2 ketone body (KB) plasma metabolites as in Figure 2, D and E (E and F). Results from 1 representative experiment out of 2 are depicted (n = 30 for group without sucrose and n = 12 with sucrose groups). Global comparison using Kruskall-Wallis test, with a post hoc multiple comparison using Dunn’s test (A–D); Student’s t test (E and F) (*P < 0.05, **P < 0.01, ***P < 0.001).

