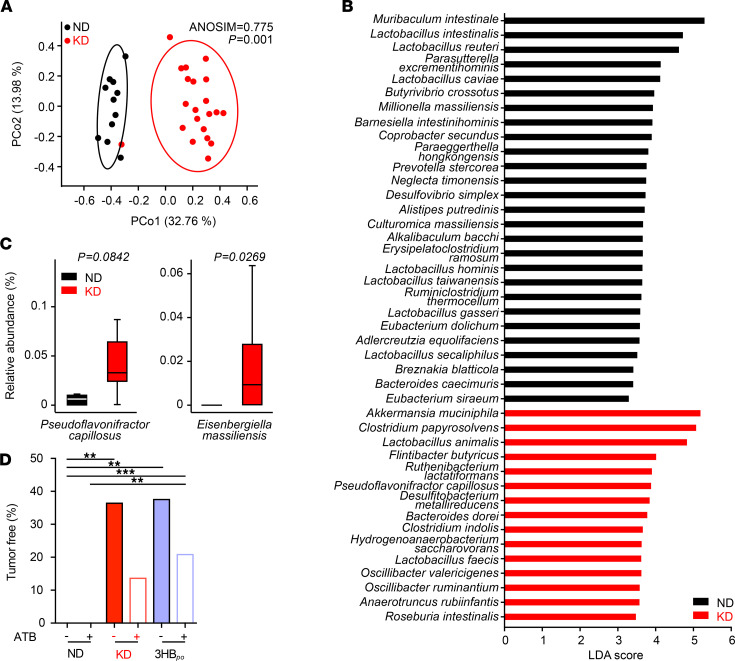
Figure 4. Ketogenic diet shifts the microbiota composition.
(A) PCoA representing the differences in β diversity of fecal microbiota between dietary interventions normal diet (ND) versus Ketogenic diet (KD) at day 12 in RET–tumor bearing mice. ANOSIM and PERMANOVA defines the separation of the groups; the P value defines the significance of such separation after 999 permutations of the samples. (B) For each principal coordinate axis (PCo1 and PCo2), the collected variance, the Pearson r coefficient and the corresponding P value are shown. Partial Least Squares Discriminant Analysis (PLS-DA) plot of the variance between KD- and ND-fed tumor-bearing mice. LEfSe plot of species at day 12 discriminating ND- from KD-fed tumor-bearing mice, ordered by their LDA score. (C) Detailed relative abundance of distinct species. Refer to Supplemental Figure 4 for additional taxa. (D) Effects of broad-spectrum antibiotics on the percentages of tumor-free mice after ND or KD or 3-hydroxybutyrate per os (3HBpo) after RET inoculation. Data from 2–3 experiments involving 5–6 mice/group are depicted (n = 12 for ND group and n = 21 for KD group). Student t test or ANOVA. **P < 0.01.***P < 0.001.

