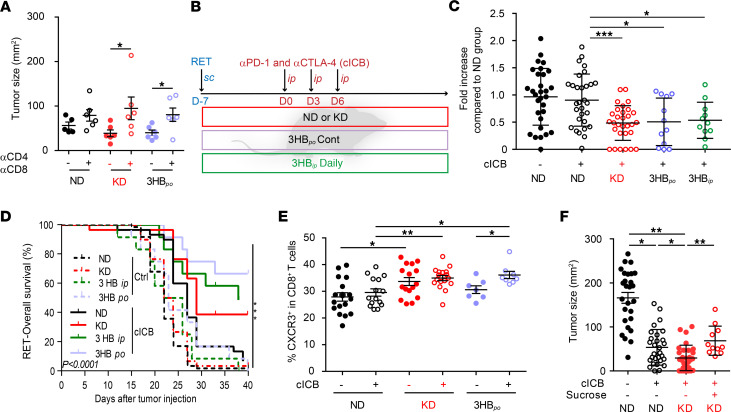
Figure 6. T cell–dependent effects of ketogenic diet and synergy with immune checkpoint blockade.
(A) Effects of T cell depletion on tumor sizes at day 12 of diet interventions. Tumor sizes in all diet-fed (normal diet [ND], ketogenic diet [KD], or 3-hydroxybutyrate per os [3HBpo]) groups in the presence of i.p. injections of anti-CD4 and anti-CD8 depleting Abs prior to tumor inoculation. A representative experiment out of 2 is depicted, both yielding similar conclusions; each dot represents 1 mouse, and each group contained 5–6 mice. Mann Whitney U statistical analyses was used. *P < 0.05. (B) Experimental setting for combinatorial regimen. (C and D) Effects of diet interventions on tumor size (C) at day 9 after RET inoculation and diet intervention, after only 1 i.p. administration of cICB (anti–CTLA-4 plus anti–PD-1 mAbs) and overall survival (D). Results of 4 concatenated experiments are depicted; each dot represents 1 mouse (n = 30 for ND and KD groups; n = 12 for 3HBpo and 3HBip). (C) Fold increase of tumor sizes in cICB groups fed with ND, KD, or 3HBpo or 3-hydroxybutyrate i.p. (3HBip) (normalized to ND groups). (D) Overall survival appreciated with Kaplan Meier curves for 12 animals/group after a complete treatment combining continuous diet plus cICB, according to B. (E) Flow cytometry analyses of Tc1 (defined as CXCR3+CD8+ T splenocytes) at day 9 of the combinatorial regimen; each dot represents 1 spleen. Results from 2 pooled experiments are shown. (F) Effects of sucrose supplementation on the synergy between diets and cICB against RET tumor progression. Individual tumor sizes at day 19 of 3 concatenated experiments involving 6 mice/group are shown for each diet intervention; each dot represents 1 tumor/mouse (n = 27 for groups without sucrose, n = 28 for groups on sucrose). Student’s t test (A); global comparison using Kruskall-Wallis test and post-hoc multiple comparisons using Dunn’s test (C and E–F). *P < 0.05, **P < 0.01, ***P < 0.001.

