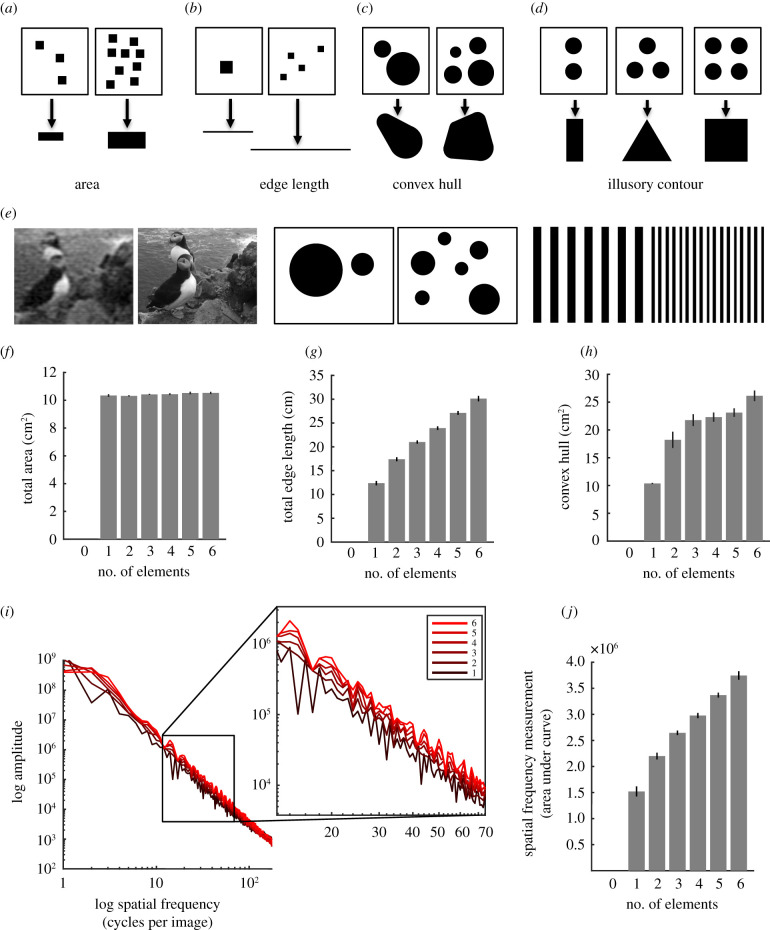
Figure 1.
Number of elements naturally covaries with non-numerical cues. (a–d) Examples of two-dimensional stimuli used in numerical cognition studies and how different continuous cues normally covary with numerosity. Note that illusory contour does not covary with numerosity but can still be learned and used to solve numerical cognition tasks, especially with lower numbers of elements. (e) Spatial frequency (the amount of alternating dark and light regions in a given area) also normally covaries with numerosity. The more changes from black to white across an image in all directions, the greater spatial frequency. The right images of each pair in (e) all have higher spatial frequency than the left images. (f–h) For all stimuli in [28], from which our stimulus set was borrowed, area (amount of total black) was kept constant (f), but edge length (total boundary length; g) and convex hull (the minimum convex region covering all elements; h) covaried with numerosity. (i,j) Spatial frequency is calculated by obtaining a power spectrum (Methods) and measuring the area under the power spectrum's curve. The power spectrum plots (i and zoomed-in inset) for all stimuli in [28], from which our stimulus set was borrowed, averaged for each number of elements from one to six, shows that spatial frequency increases with numerosity (j). Note that for all covarying continuous cues, a zero-set stimulus will have zero measurement and thereby be placed naturally at the lower end of the spectrum for each of these non-numerical cues. (Online version in colour.)

