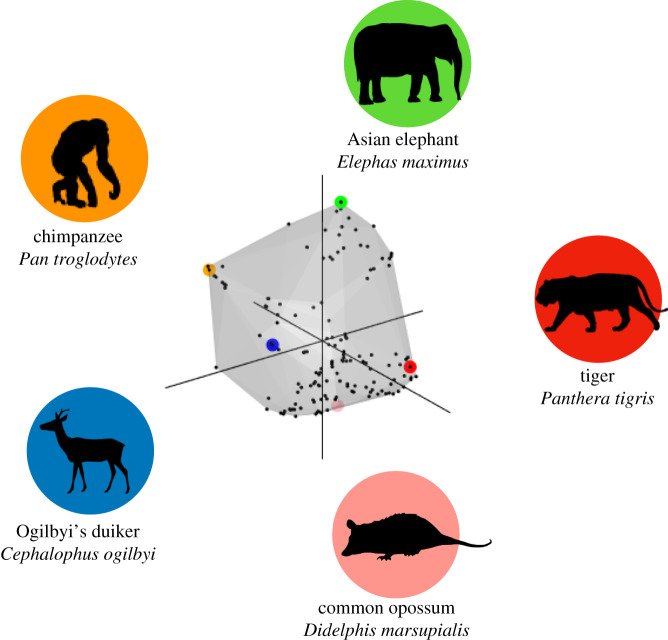
Figure 1.
Total trait space occupied by species found in realized communities of all TEAM sites. Grey shading indicates the three-dimensional convex hull of this trait space, which represents the first three axes used in the functional diversity calculations. Black points represent species. Example species represented by coloured dots with silhouettes correspond with coloured circles in trait space. Opossum image created by Sarah Werning, licence available at https://creativecommons.org/licenses/by/3.0/. (Online version in colour.)

