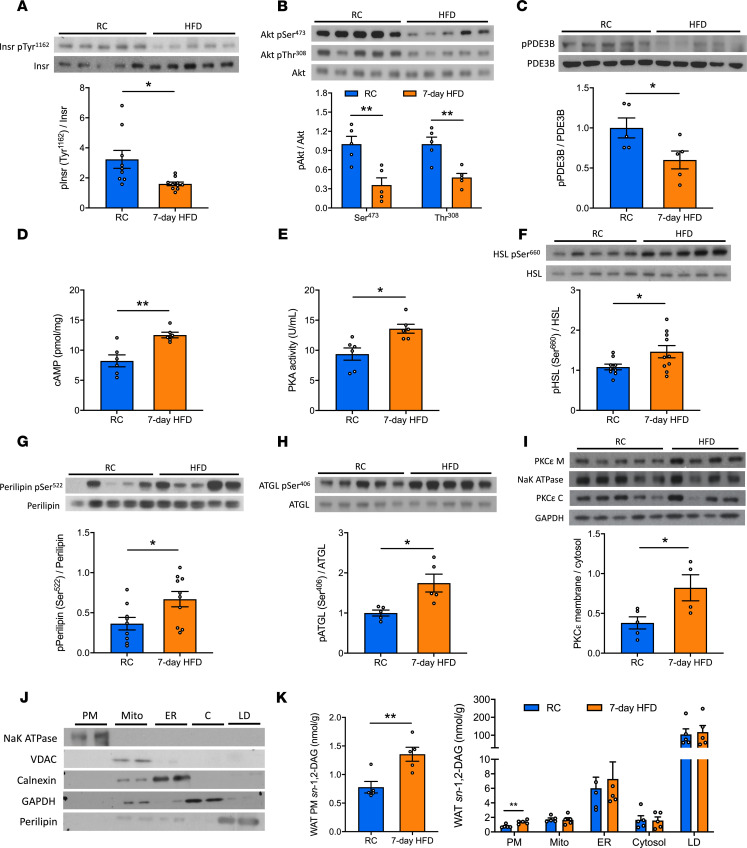
Figure 2. Seven-day HFD feeding impairs insulin-stimulated insulin signaling cascade in WAT associated with increases in plasma membrane sn-1,2-DAGs and PKCε translocation.
(A–C) Insulin-stimulated phosphorylation of Insr, Akt, and PDE3B in WAT. (D and E) WAT cAMP and PKA activity during the hyperinsulinemic-euglycemic clamp. (F–H) Insulin-stimulated phosphorylation of HSL, perilipin, and ATGL. (I) WAT PKCε membrane/cytosol ratio. (J) Separation of 5 subcellular compartments in WAT: plasma membrane (PM), mitochondria (Mito), ER, cytosol (C), and lipid droplet (LD). (K) WAT sn-1,2-DAGs in 5 compartments. In A–H, rats (after overnight fasting) were under hyperinsulinemic-euglycemic clamp conditions. Data are the mean ± SEM of n = 5–10 per group. In I–K, rats were under 6-hour fasting basal condition; data are the mean ± SEM of n = 4–5 per group. In all panels, groups are compared by 2-tailed unpaired Student’s t test. *P < 0.05, **P < 0.01.

