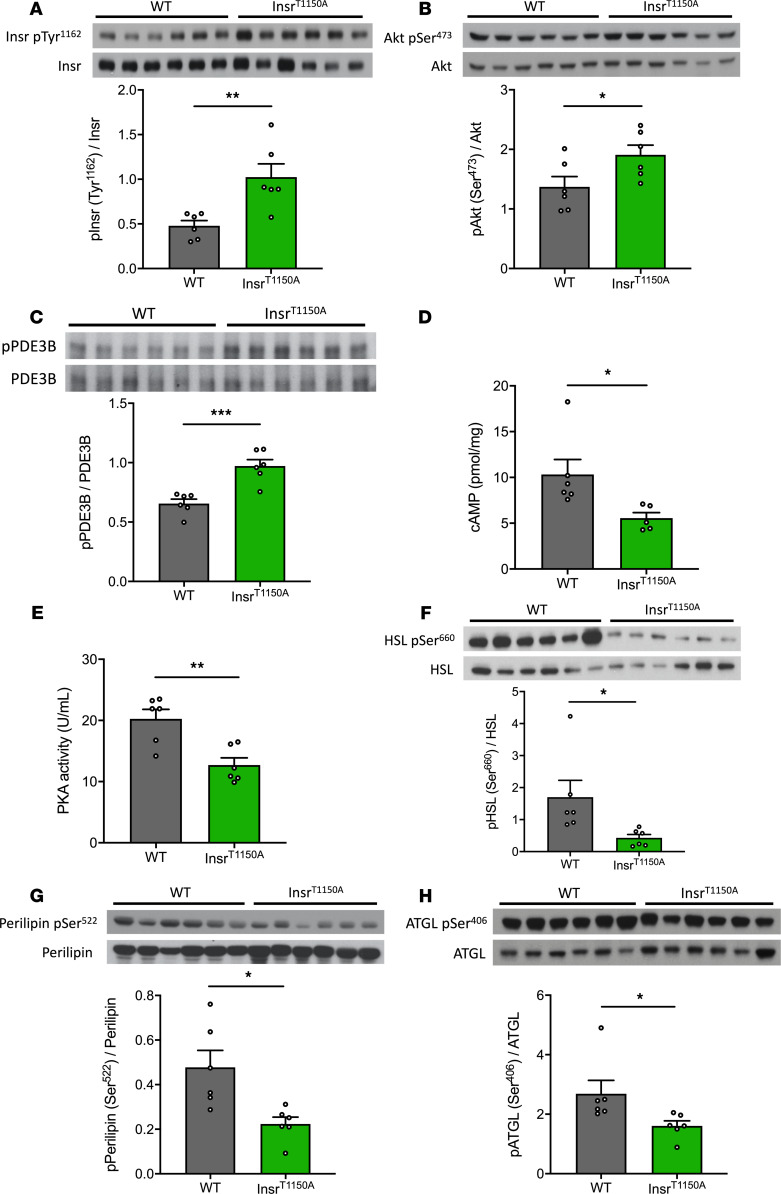
Figure 4. InsrT1150A mice were protected from HFD-induced WAT insulin resistance.
(A–C) Insulin-stimulated phosphorylation of Insr, Akt, and PDE3B in WAT. (D and E) WAT cAMP content and PKA activity during the clamp. (F–H) Insulin-stimulated phosphorylation of HSL, perilipin, and ATGL. In all panels, mice (after overnight fasting) were under hyperinsulinemic-euglycemic clamp condition; data are the mean ± SEM of n = 6 per group, with comparisons by 2-tailed unpaired Student’s t test. *P < 0.05, **P < 0.01, ***P < 0.001.

