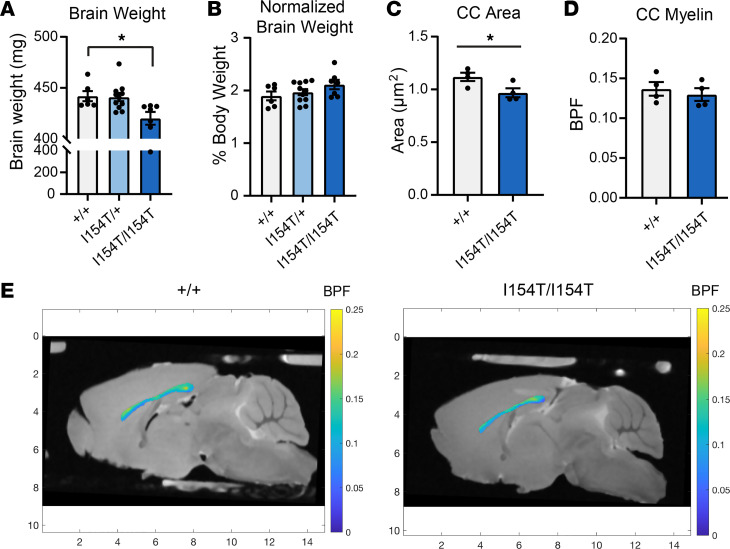
Figure 7. Mice homozygous for Grm7-I154T exhibit decreased brain weight and area of the corpus callosum.
(A) Brain weight measured from adult mice. Genotypes are as follows: Grm7+/+ (+/+), Grm7I154T/+ (I154T/+), and Grm7I154T/I154T (I154T/I154T). (B) Brain weight expressed as percent body weight. For A and B, n = 6 +/+, 11 I154T/+, 7 I154T/I154T. Data analyzed by 1-way ANOVA with Dunnett’s multiple comparisons to Grm7+/+. *P < 0.05. (C) Area of the corpus callosum (CC) from MRI experiments. (D) Quantification of myelin bound pool fraction (BPF) within the CC. (E) Representative images showing BPF intensity within the CC. The markings on the x and y axes indicate distance in millimeters. For D and E, n = 4 +/+, 4 I154T/I154T. Data analyzed by 2-tailed Student’s t test. *P < 0.05.

